
“Visualizing Emancipation” provides a detailed map of all known locations in the U.S. where a slave was emancipated in the Civil War era. This project in particular has benefited greatly from being created digitally, as it provides an interactive, simple to use interface for finding a plethora of information on emancipated slaves.
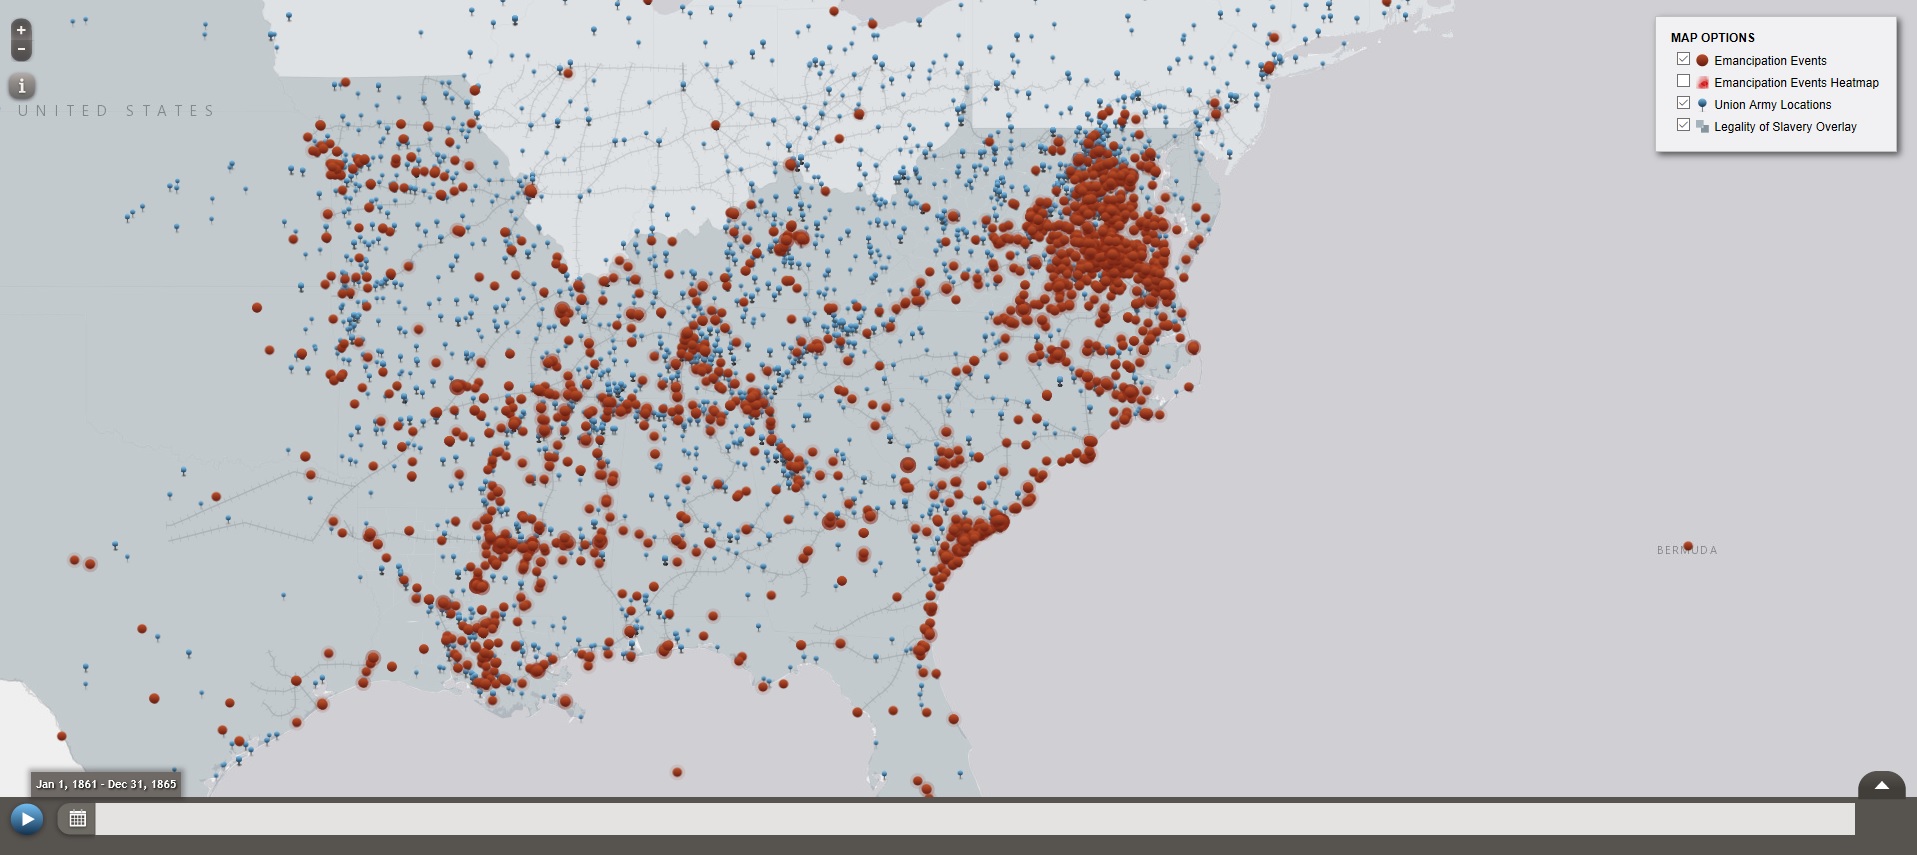
The project consists of a map with a number of red dots on it, each representing a location in which a slave was emancipated. In addition to the red dots are blue markers that represent the Union forces as they advanced through the confederacy. 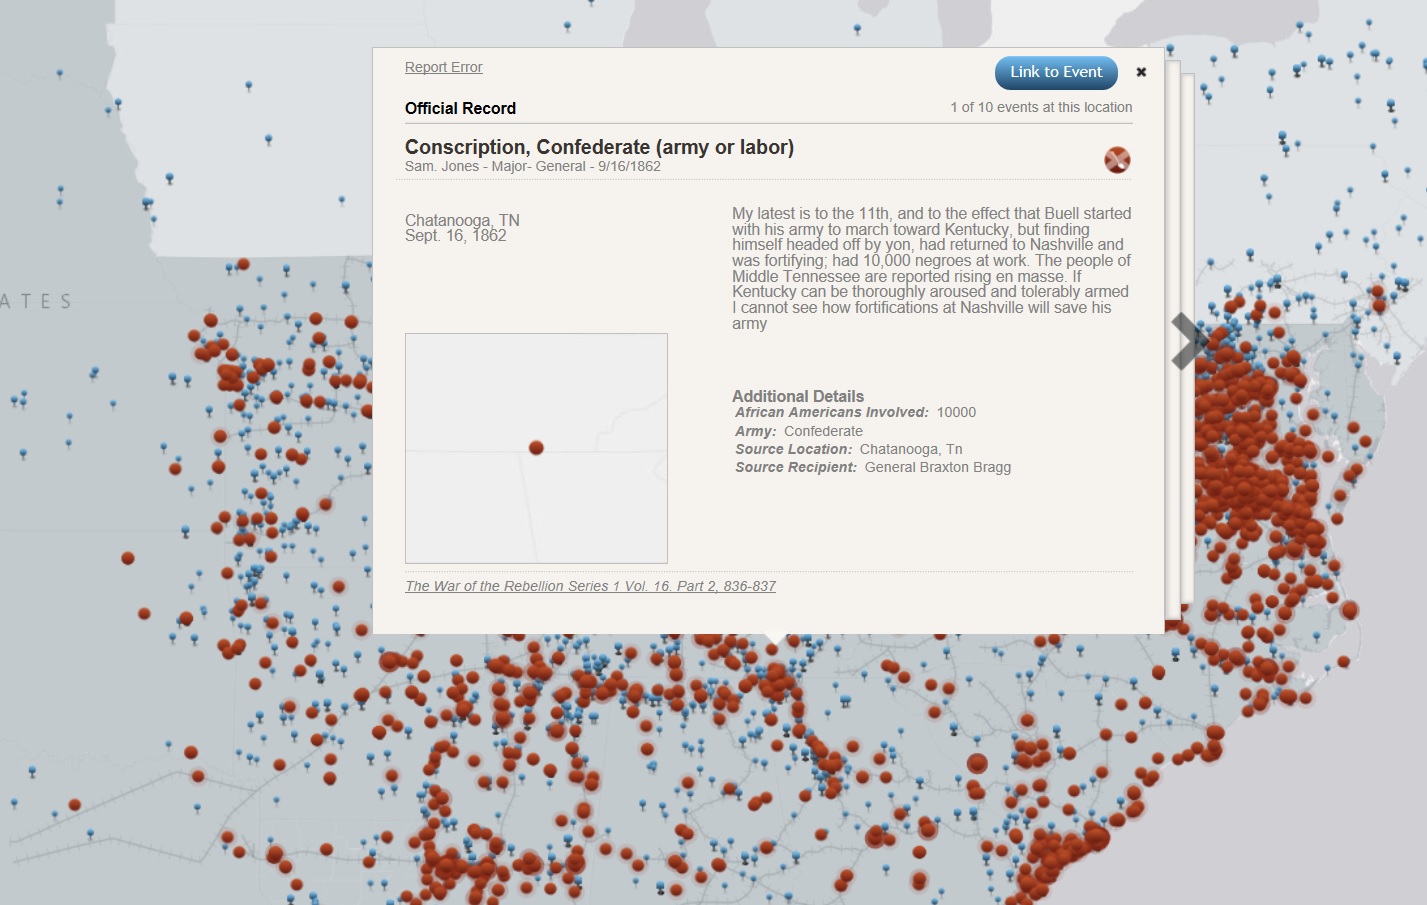
These marks serve to show the relationship between the advancement of soldiers, and the increased emancipation rates.
The project’s goal is to provide a record of emancipations as they occurred throughout the U.S., while also providing a way to visual the location and frequency of these emancipations. The project advances the humanities work of organizing cultural events, analyzing historical events, and exploring relationships between events and places. The project advances a traditional humanities aim because the digital interface of the project allows the information to be organized in a way that is much easier to read and get access to. Rather than looking through numerous books to find emancipation records, you can just click on a dot on the map and it’s right there. The project utilized XML encoding, javascript, OpenLayers, and GeoServer.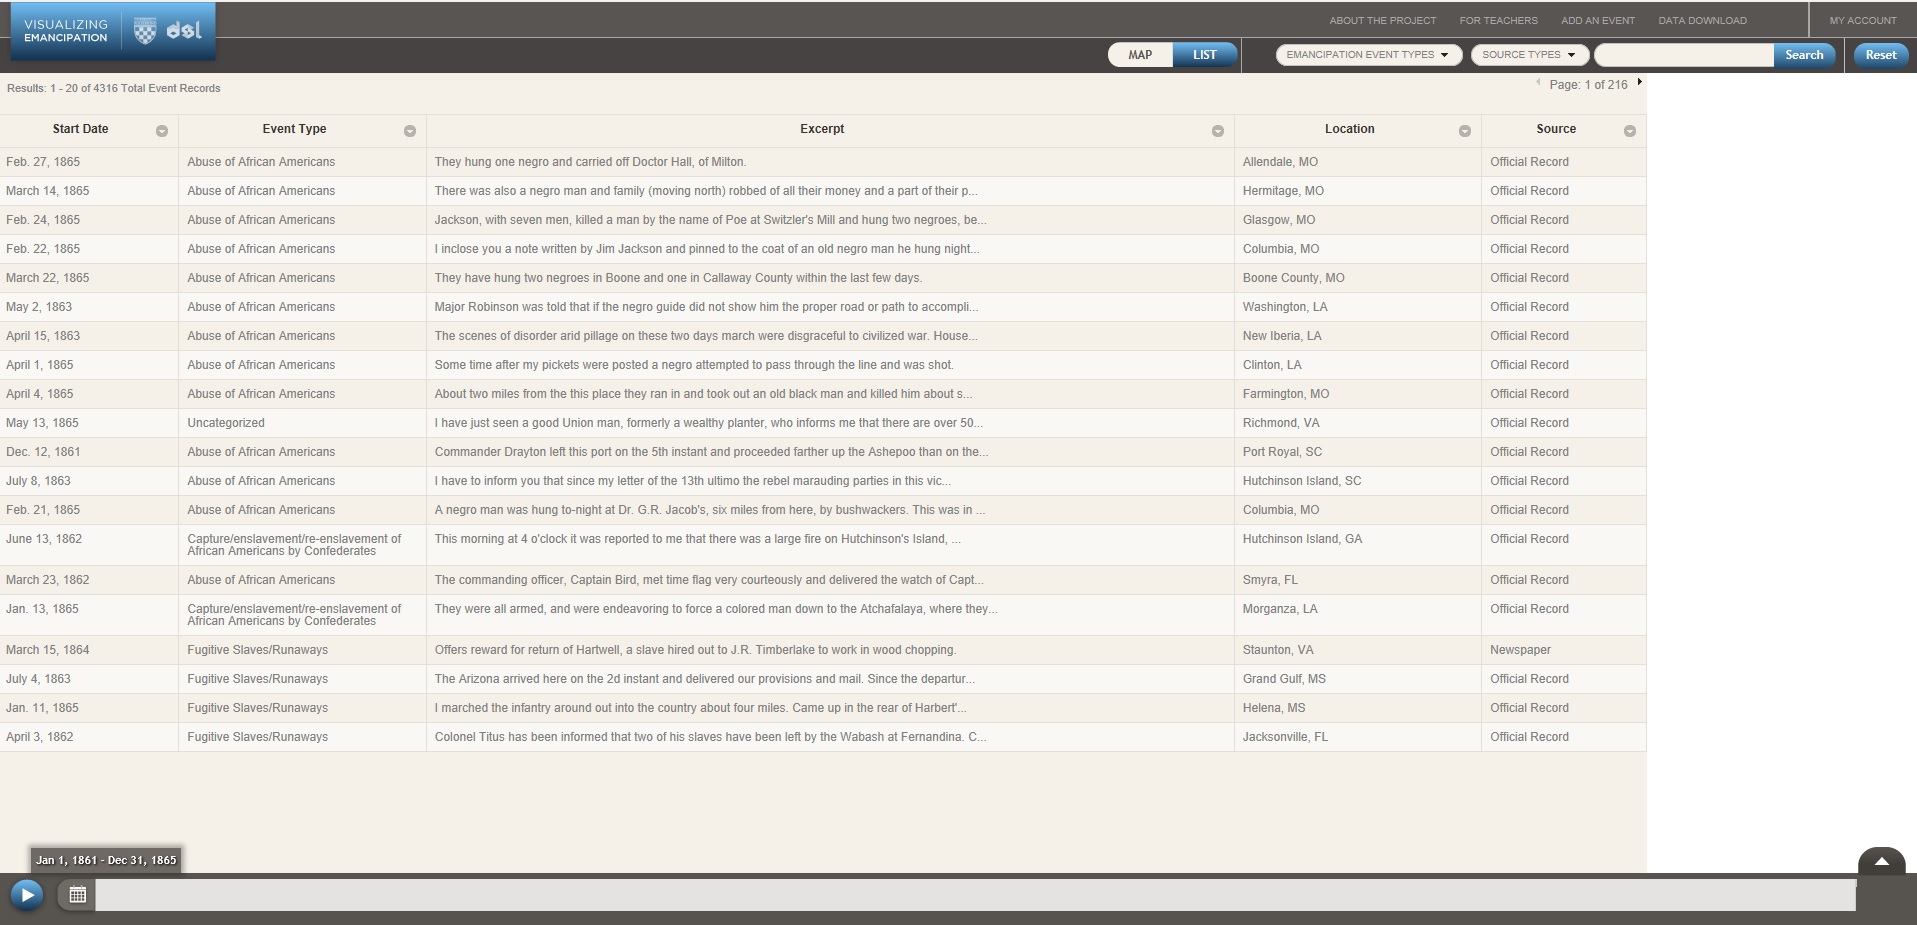
While it is impossible to fully capture every single act of emancipation that occurred throughout the time period, the project does an effective job in displaying the information in an easy to understand manner, that is packed full of information on the events.