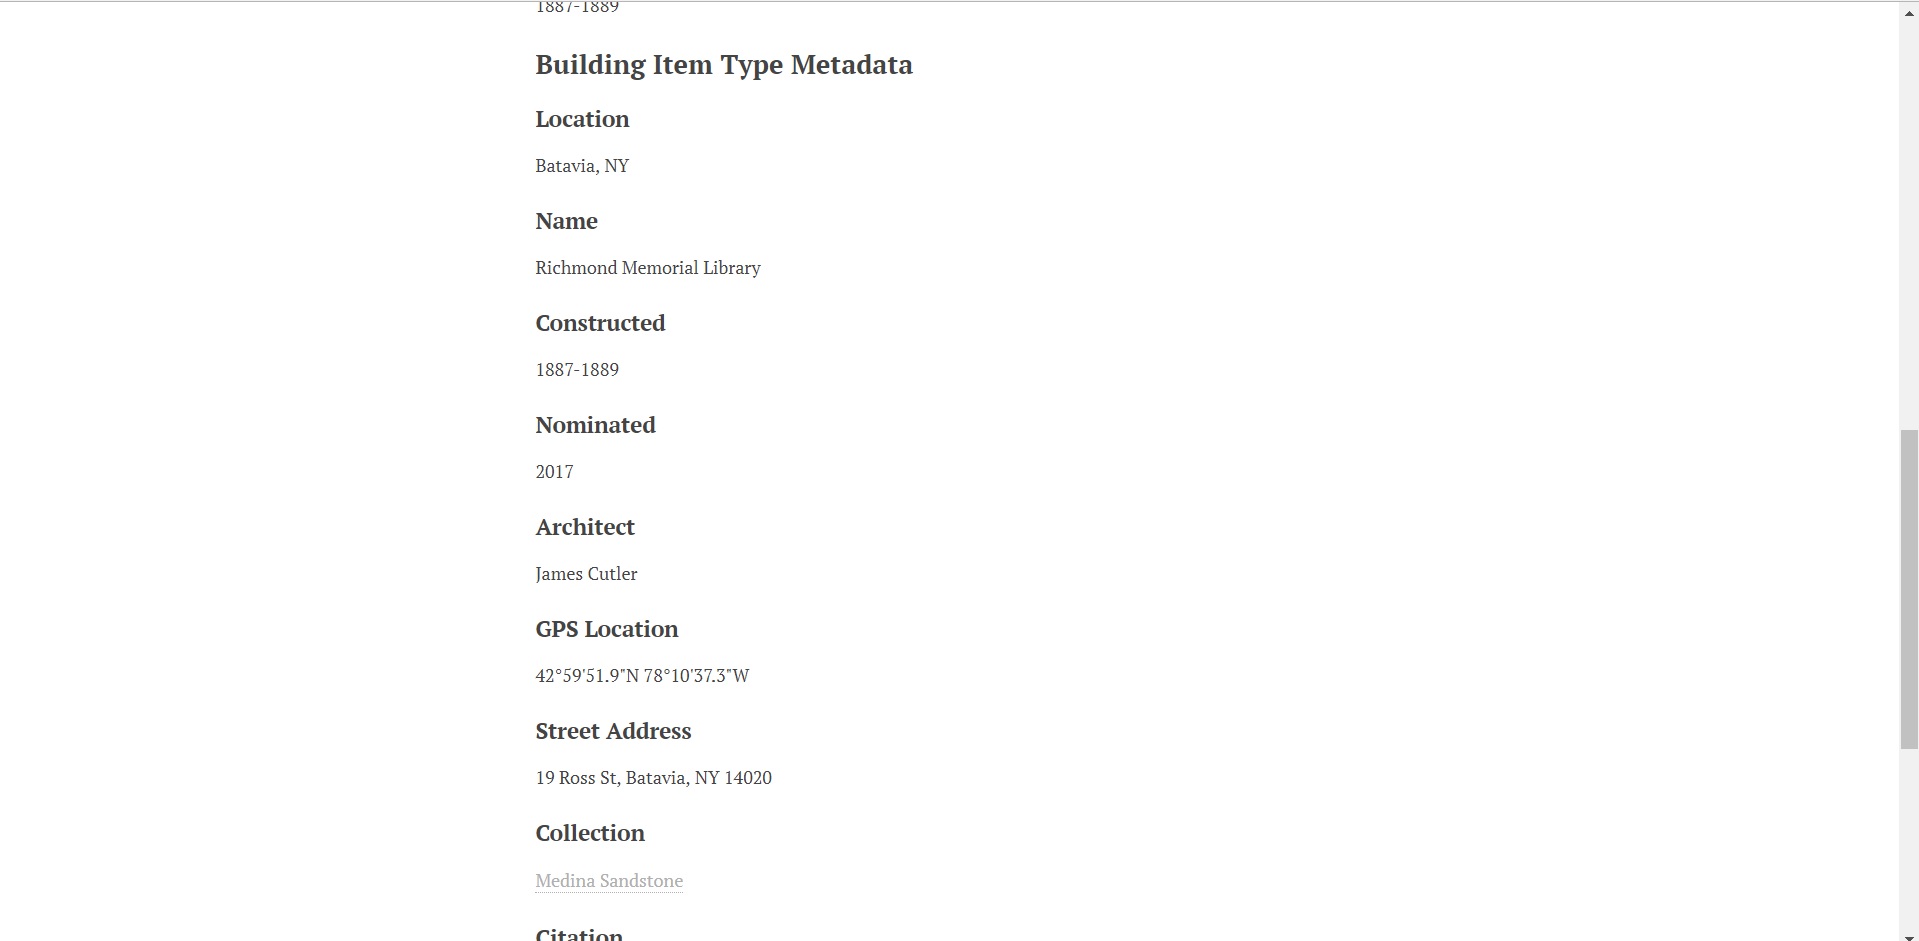
Finally, I’ve managed to get an instance of Omeka up and running, and have begun transcribing my information from my Excel spreadsheet to Omeka. The goal of my project is to still create an archive of buildings that use Medina Sandstone in New York, while also providing metadata such as their location, architect, construction year, etc. I’ve narrowed down the buildings to those that are in the “Sandstone Hall of Fame,” which was created by the Medina Sandstone Society. 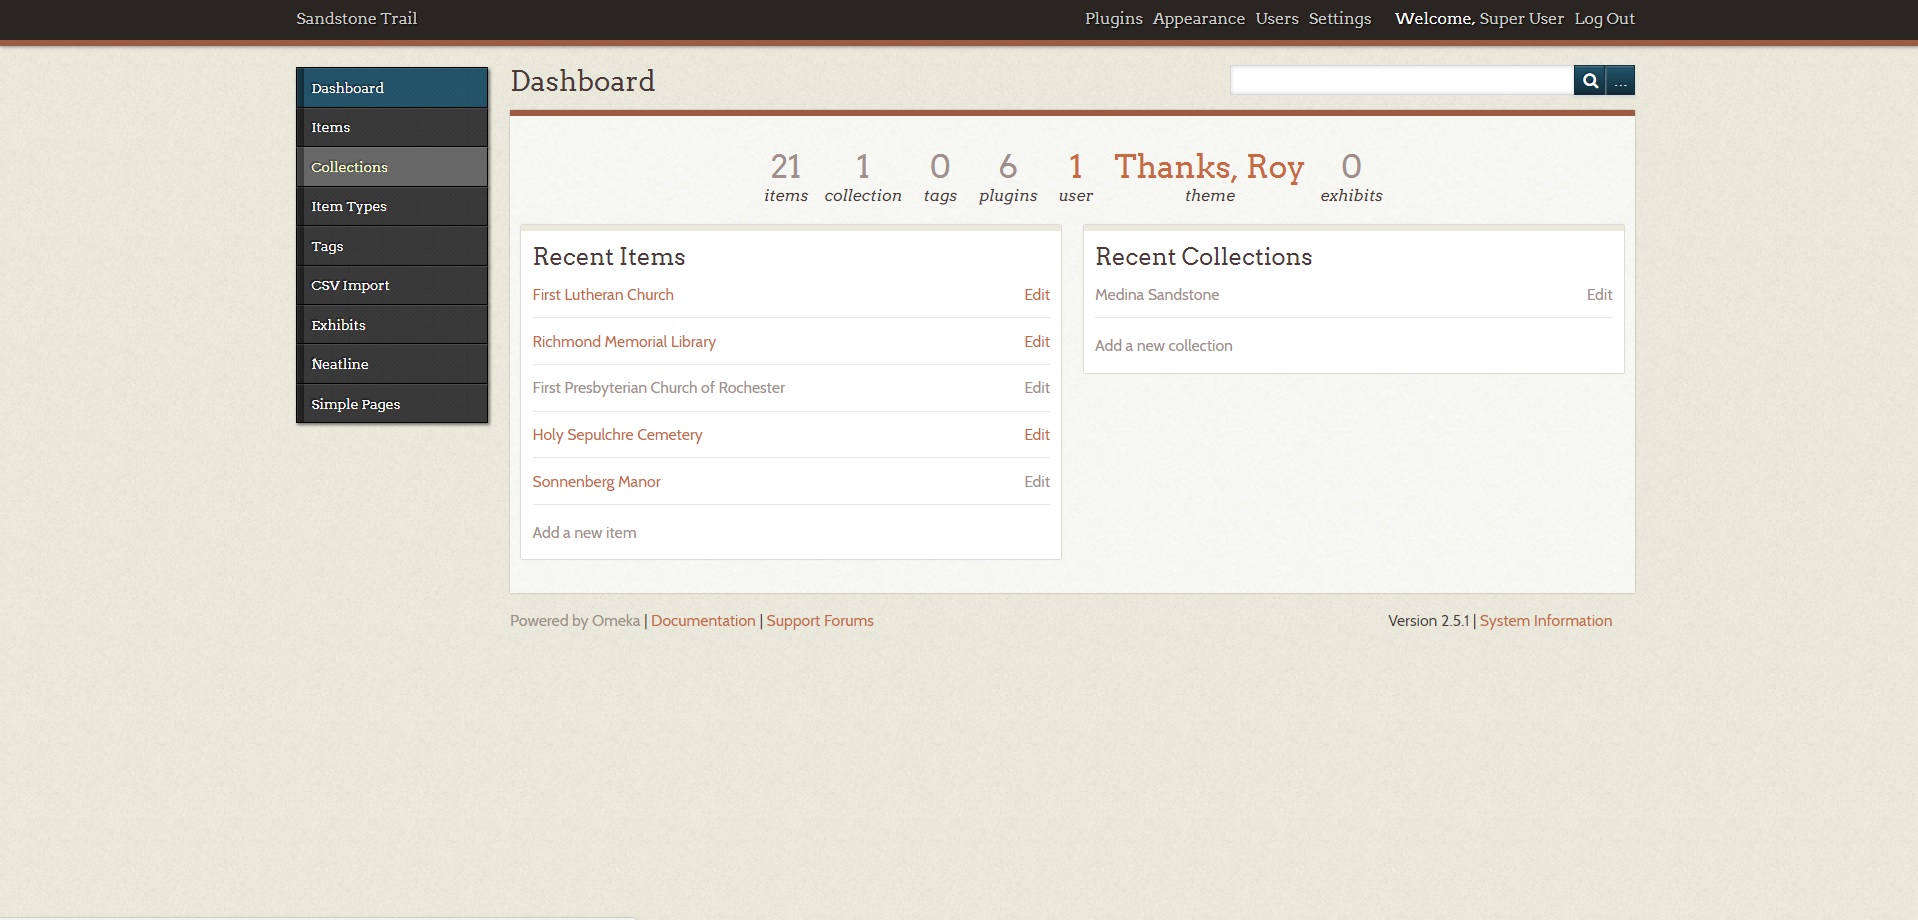
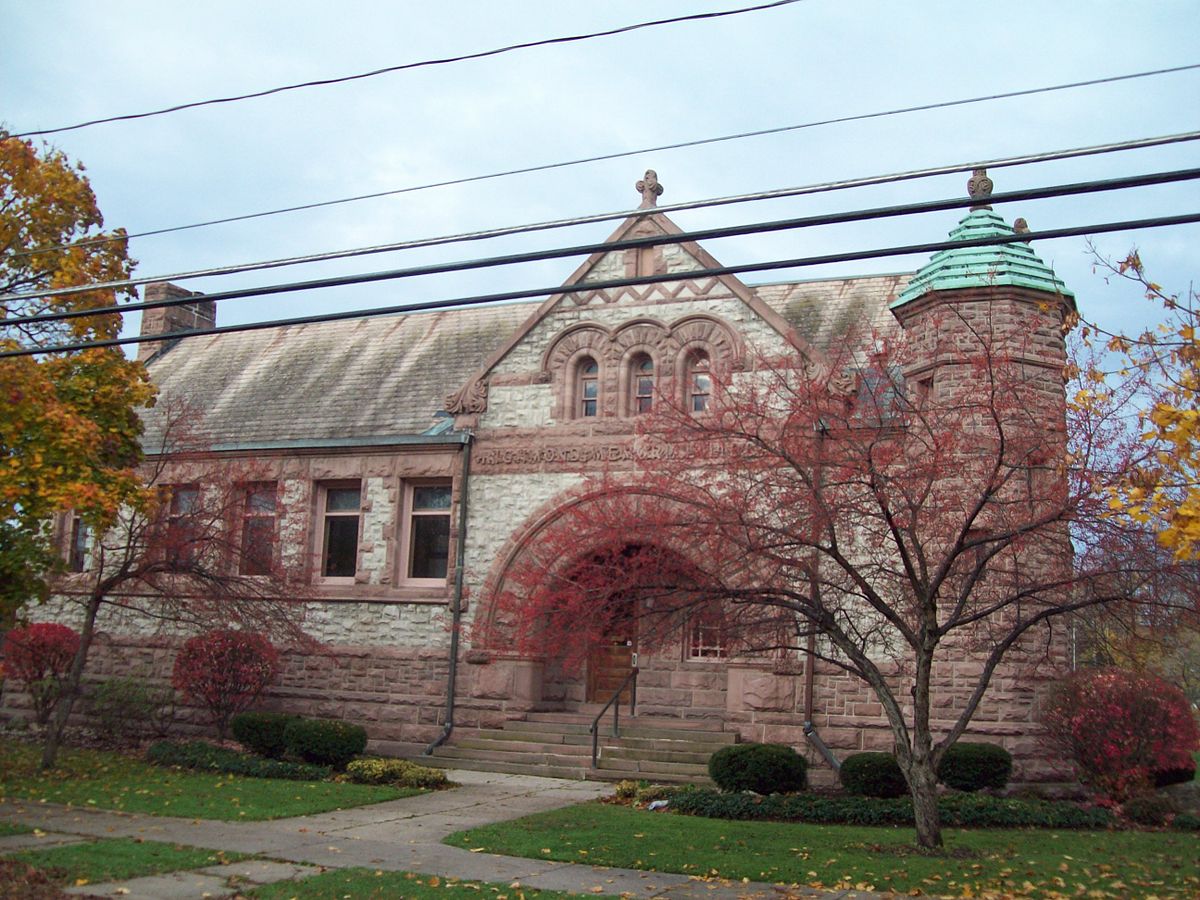
Despite prior problems with Omeka, the platform has proven to be quite accessible. It was very easy to upload my information on to the platform and create tags for metadata along with it. The difficulty now lies in getting the mapping plugin, Neatline, to create a map for the information I’ve uploaded. This map is central to my project, because it is what differentiates this information from its physical form, by providing a visual of the buildings and their relation to each other, and Medina. 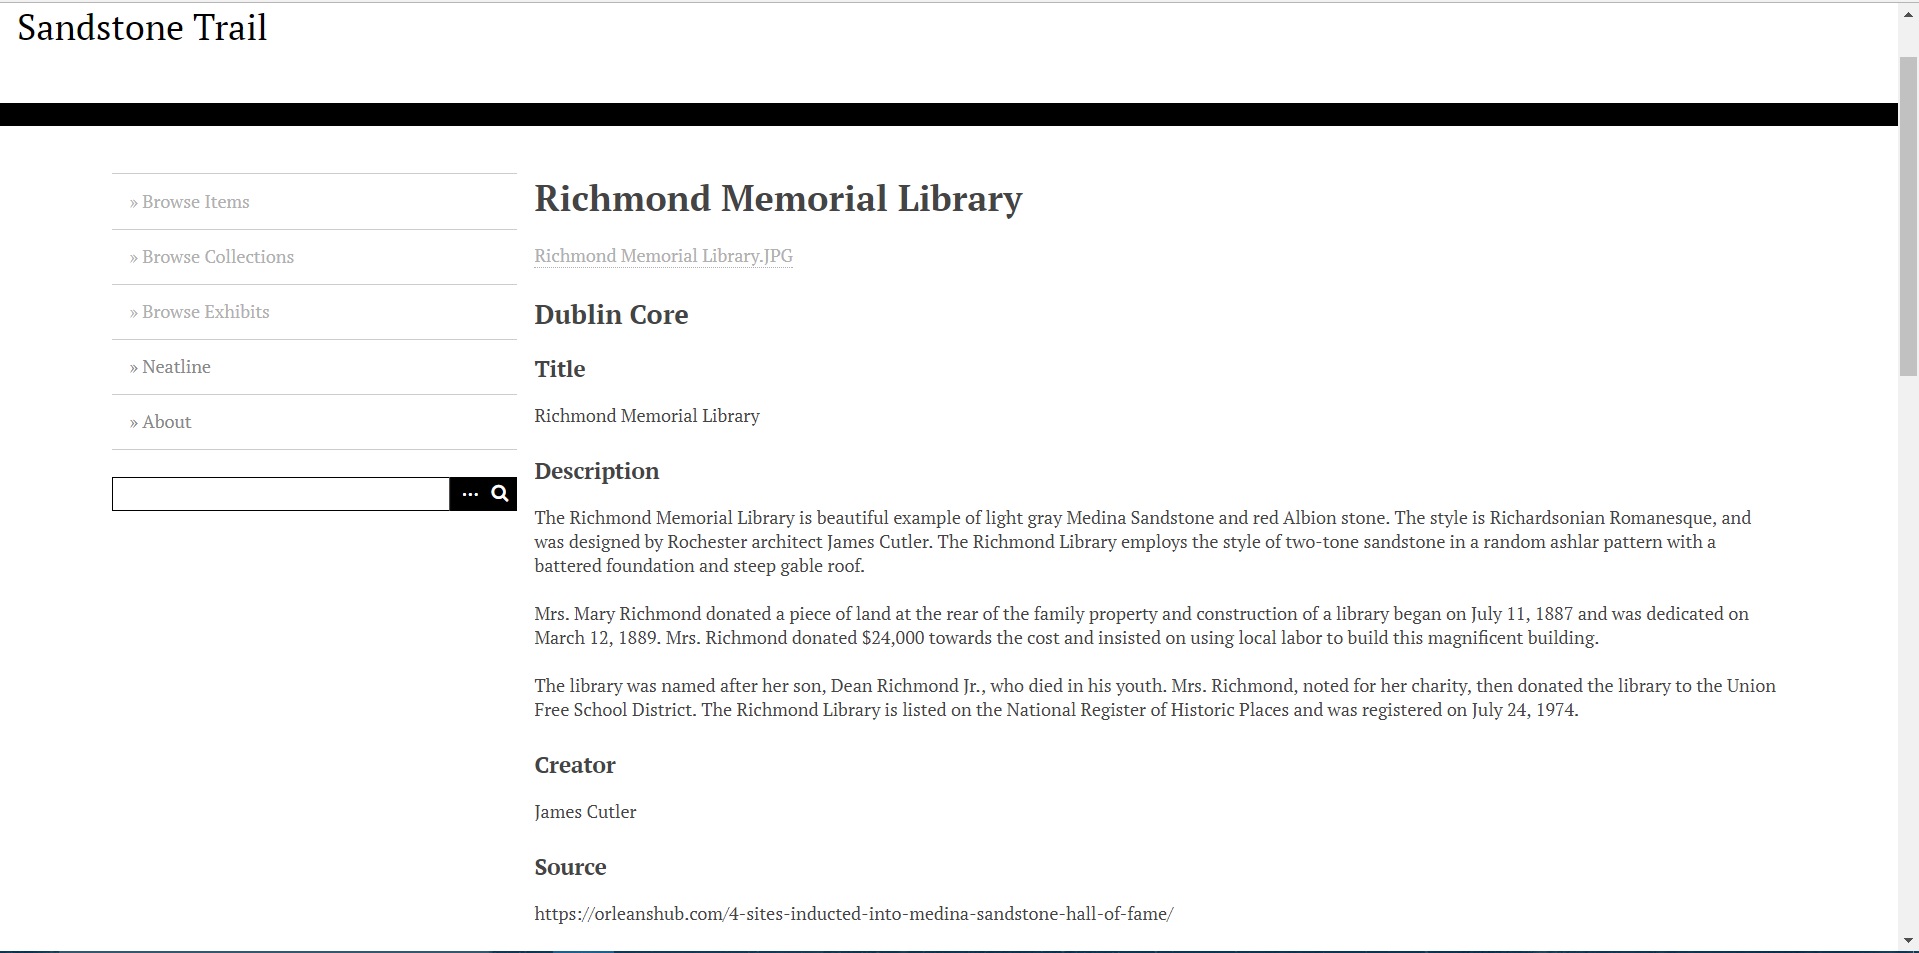
Once this visual portion is up and running, it will reveal some of the observations that I’ve already discovered through my work. For instance, the concentration of buildings decreases greatly as the distance from Medina increases. This raises interesting questions as to why this was. Perhaps transportation issues? Also, what was the primary transportation method for the sandstone? Another observation was that there weren’t any buildings in the list that were built past 1901. What is the reason for this? Did the sandstone industry see a decline during this time? Was there a lack of resources? Or maybe a lack of interest?
A limitation of Omeka that I’ve noticed is the inability to display an image right on the page of the item that is selected. This could just be due to a missing plugin, and the image can still be opened from the page, but it’s an aesthetic issue that does bother me. Another limitation is the lack of aesthetic options to change the style of the page. I’ve have to look more into this to see if I can find a cool theme. Another feature that does not seem to be present is a graphing function, so that I could display the frequency of the buildings that were constructed and when they were most/least popular. I’ll probably just end up creating that graph separately and uploading it individually. Lastly, the lack of functionality with Neatline is annoying, but hopefully Kirk will be able to find a solution, so that I may begin working on that aspect of my project.