Black Politicians in the Post-Civil War Natchez Region

After the Civil War, there was a surge of African-Americans into politics. This lasted until the late 19th century, when racist practices and legislature forced many African-Americans out of the political sphere.
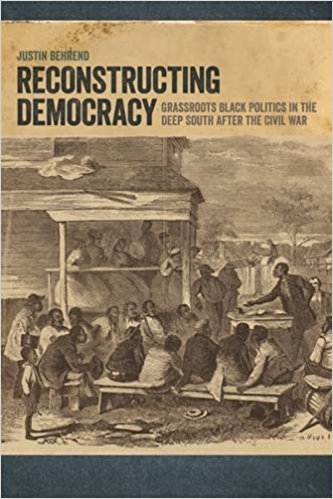
Professor Behrend, a history professor at SUNY Geneseo, focuses his research on black politicians during this time period, specifically in the Natchez region. This region—named for the city of Natchez—comprises six main counties straddling Mississippi and Louisiana. Behrend’s book, Reconstructing Democracy: Grassroots Black Politics in the Deep South After the Civil War, argues that the amount and range of offices held by black politicians during this relatively short period of time (roughly 30 years, from the late 1860s to the 1890s) represents a grassroots democracy movement by black communities in opposition to the white power structures surrounding them.

Data collected by Behrend about the African-American politicians during the post-Civil War Natchez region covers both information about the offices they held as well as personal information such as other occupations, literacy status, county affiliation, and many other categories. Professor Behrend stored this information in a spreadsheet which he published to the web a few years ago. Through this digital humanities project, Professor Behrend and I wanted to create a new and more interactive place to store this data. Based on that goal, I knew I wanted to create a map of the politicians.

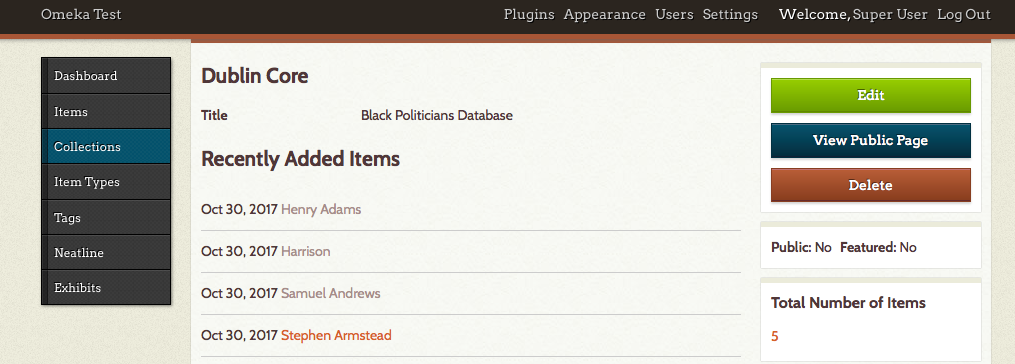
My project website, hosted by Omeka, opens with a short “About” page to give any visitors context about the origins and purpose of the project. Visitors can then click on the “map” tab to take them to the map I created using Neatline. Visitors can also click on either the “Browse Items” tab or the “Browse Collections” tab to peruse the data by individual person. I also have a tab labelled “Credits” where I give credit to and thank those who have helped me along the way with this project, namely Professors Behrend and Schacht, Dr. Kirk Anne, and Wayne Graham on GitHub (whose Neatline base map I used as the background for this project).
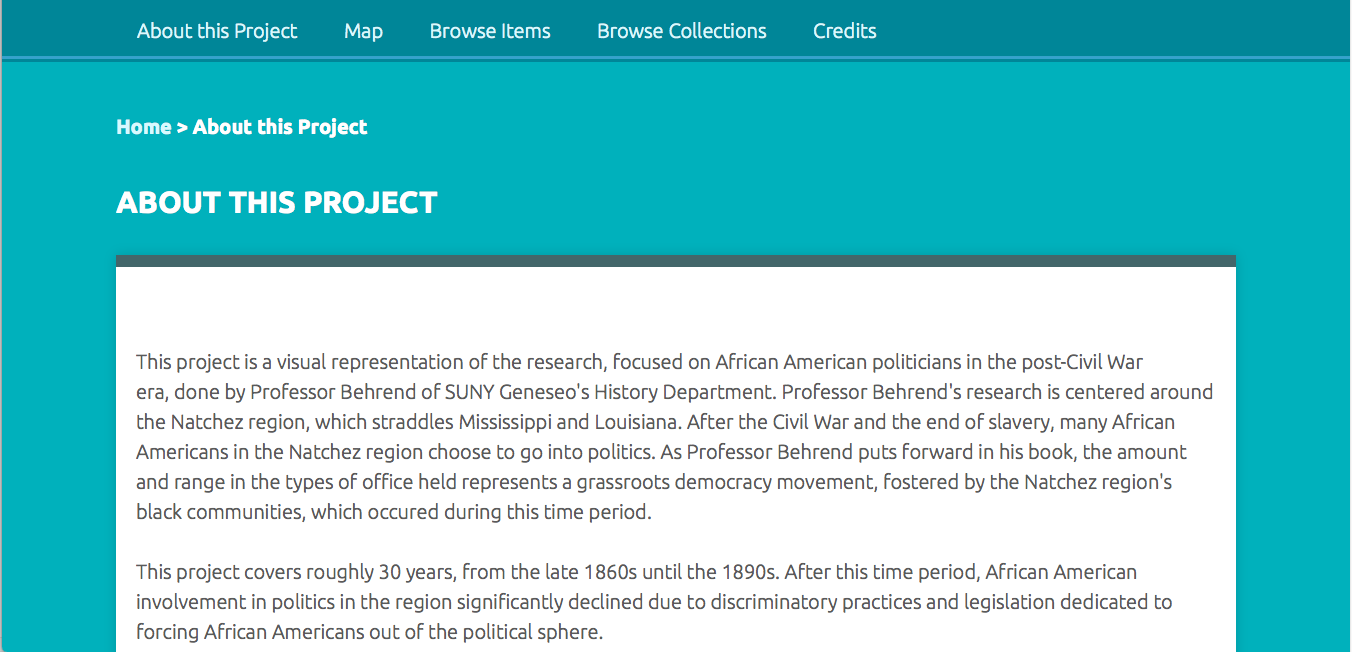
Homepage for my Omeka website.

I decided to use Omeka and specifically the plugin Neatline to create the map. I decided on this because I knew that Neatline could create a map with multiple elements, including layers for the multiple counties and a pop-up box with information about the person when you click on their point on the map. Using a map to visualize data (especially connecting people and places) is an idea seen very often in traditional humanities. Seeing data, rather than simply reading about it, is a well-known method of increasing one’s understanding of the data and the overall argument. This project in particular uses a map to emphasize Professor Behrend’s argument about black communities creating a grassroots democracy through becoming elected officials in their region. When one first clicks on the map, it is obvious by the amount of points on the map that African-American political activity was significantly high during this relatively short time period. Beyond the traditional humanities, hosting a map on an Omeka site through Neatline—instead of creating a physical map—adds another useful element because you can include significantly more information. A digital map created with these programs allows an interested party to not only visualize the concepts but read more about each individual person represented in the data. A physical map does not have the ability to load up a sidebar of information when one clicks on a data point. The power to do this, particularly in a case like this project where you have many data points (roughly 400), makes the digital map even more useful than a physical one.
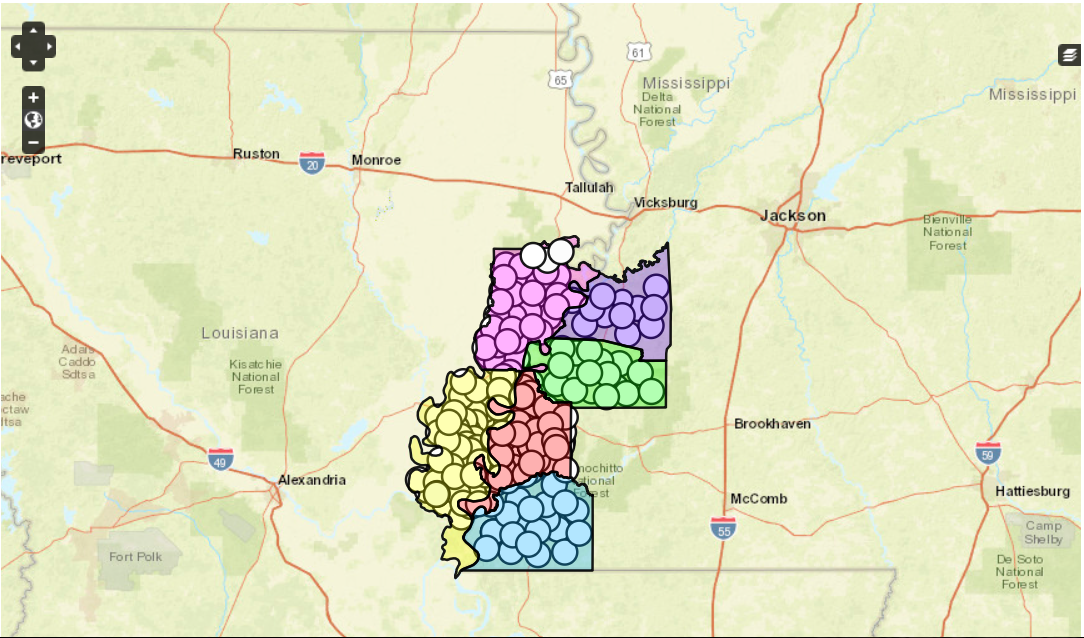
Map, created with Neatline, of black politicians in the Natchez region. Each colored shape represents one of the six main counties of the region and each dot represents an individual politician.

Another advantage of using Omeka was how well the archiving portion of the software suited the spreadsheet origins of this project. While archives are created and used all the time by traditional humanities projects, having an online archive run by Omeka offers additional features that a physical archive does not. The first advantage is the enlarged audience a digital archive can reach. Being able to access the archive using the Internet (not having to travel to a physical place) opens the door for more people to find and use the data. A digital map may also attract a larger audience since it is a quicker and easier way of demonstrating a main concept than reading the book. The other significant advantage of a digital archive is the interactive portion that Omeka offers. When I started this project, I did not anticipate that the Omeka archive would be searchable. However, now at the conclusion of this project, I realize that being able to search all items for specific terms is incredibly handy. For instance, if someone is searching the database for a specific person but only knows their occupation (say carpenter) and their birthdate (say 1837) then they could search the database for “carpenter” and cross-reference the results for people born in 1837 to find their person. The searchable aspect of this digital archive is also useful for anyone utilizing the data to find patterns for their own projects.
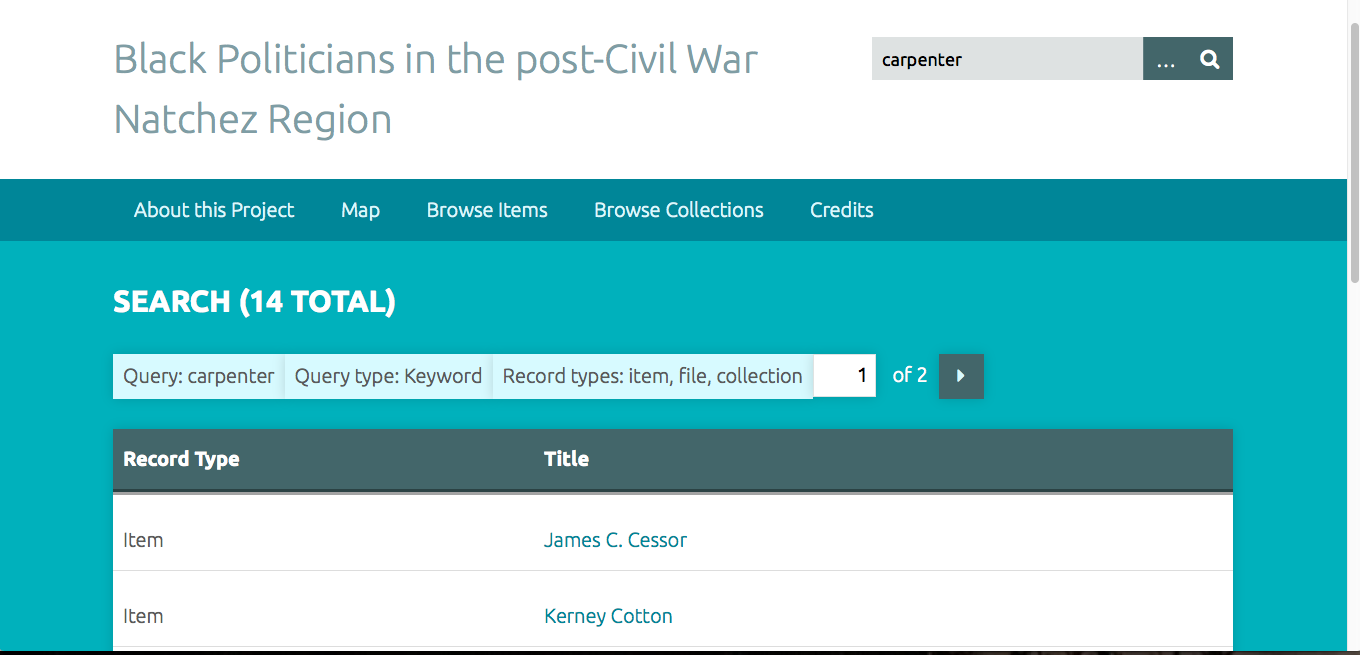
Example demonstrating what searching for “carpenter” among the Omeka items yields.

While creating this project I encountered a few challenges working with Omeka and particularly Neatline. The first problem I encountered was getting Neatline to work on my computer at all. Professor Schacht helped me solve this problem as he posted on a help forum and figured out that a typo in the Neatline file folder was preventing functional use of the program. A problem I ran into while creating the map was uploading files which had outlines of the county maps. I had found a website which specialized in historic county maps and had them available for download as either ArcGIS or KML files. Originally I thought I would be able to turn the KML files (KML being a type of XML) into SVG files, which are importable to Neatline. However, I could not find a KML to SVG converter that had the ability to convert the files. To overcome this problem I utilized Neatline’s “Draw a Polygon” tool and traced the county borders myself.

Overall, I learned how to work with online exhibits, data collections, and digital maps. At the beginning, while I was figuring out which program to use, I played around with Google MyMaps and TimelineJS so I learned the basics of those programs as well. Learning how to use Omeka is particularly relevant to me since I am currently applying to graduate school for archive management. Omeka is often used by archivists to create online collections so learning how to use the program and gaining hands-on experience with it will most likely be useful for me in the future. Engaging with questions of how to create a digital archive and map—both in the technical sense of how to use the programs and in the more abstract sense of what information to include, how to space the data points, and what each design decision means for the interpretation of the data—has given me a solid introductory grasp on what the digital humanities are and how they can be applied.

While my project did not necessarily reach any new conclusions about this data, I think it did reinforce Professor Behrend’s thesis in a new way. Being able to see how many African American politicians existed in this region (roughly 400) over a fairly short period of 30 years underscores the political and social agency which black communities created for themselves. This period of black political activity is often not covered in American history classes so it is important to acknowledge its existence. Using Omeka and Neatline offered a way to both create an interactive digital archive—an evolution of Behrend’s original spreadsheet—as well as convey this thesis through a visual component.

Progress Report: Map of Black Politicians in the Natchez Region following the Civil War

For my project I have been working with Professor Behrend’s research on black politicians in the Natchez region after the Civil War. My final goal is to create a map, or at least the prototype for a map, detailing each person Professor Behrend has information on. With the map, I want to emphasize the change in the amount of black politicians in this region over time. Focusing on this increase highlights the grassroots democracy occurring during this time period, which is one of the main concepts in Professor Behrend’s book. I believe that a visualization of this concept (in this case, a map) would further underscore the point, particularly in a form that takes less time to consume and process than a book.

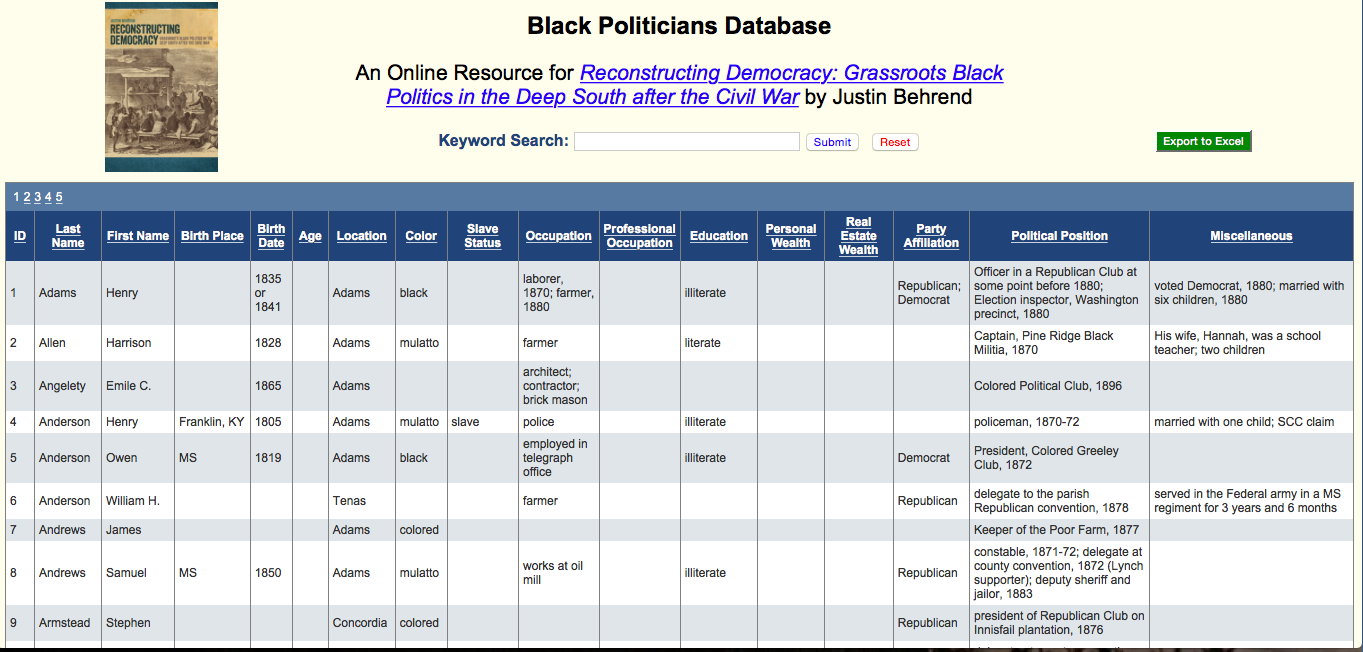
As it stands currently, Professor Behrend has his research on each politician stored in an online spreadsheet. Besides name and political office(s) held, the spreadsheet also includes biographical information such as birth year, county, occupation (besides political office), wealth, literacy status, slave status, and party affiliation.

Online spreadsheet storing Professor Behrend’s research.

If all works out, I plan to use Omeka with the plugin Neatline and SIMILE Timeline in order to create the map. I chose these programs because of their ability to both create a map and incorporate a timeline. The timeline is important, I believe, because I want to emphasize change in the political circumstance of this region over time.

Installing Neatline has been one of the technological problems I have encountered so far. I have Omeka installed and running on my computer, but Neatline has been more of a problem. Apparently Neatline can be difficult to work with, so in order to deal with this Kirk and I have discussed getting a version of Neatline to run on a campus computer and doing the work for the project there.

Screenshot of the page I encounter while trying to use Neatline.

Currently Kirk and I are also working to create a comma-separated value (CSV) file of the spreadsheet data. One of the main problems we have been running into with the spreadsheet format of the data is slight spelling inconsistencies and multiple values in one category. For instance, the spelling of “mulatto” differs slightly between people (due to the different spellings in the original records Professor Behrend was working off of). While a person could understand that it is two different spellings of the same word, a computer cannot without being told. Different spellings have made the data somewhat harder to sort out.

The other main formatting issue occurs when one category has multiple values. For instance, if a person held more than one political office, those two (or three, or four, etc.) are all under the category “Political Position.” The computer reads each category as one value, so if one person was a constable and another was a constable and a delegate, it would not recognize those two people as having had the same position. “Constable” and “Constable and delegate” are completely different values (not overlapping) to the computer. In order to solve these formatting issues, Kirk and I are creating a CSV file, where a comma indicates that what came before and what comes after the comma are completely separate values, even if they are in the same category. This will allow me to work with people who had multiple positions, was illiterate at one point but literate at another, or any other category that has multiple values. This CSV file will be uploaded to Omeka as a collection, which will then be used to create the map.

Example of a collection in Omeka.

In terms of the content itself, the major issue is sometimes there is not enough specific information. For instance, the location for each person is a county. This means that many people have the same location, so when I try to map them they are all in the same spot. Instead of looking like multiple points on the map, it simply looks like one point for each county. In order to combat this, what I have decided to do is place each person randomly throughout the county and have a disclaimer somewhere on the map which indicates that this, within county lines, the placement of markers is random. Another content problem is that sometimes we are missing values for certain categories. While most missing values are simply inconvenient—as we would like to be able to provide more information on each person—the one area that is it hindering is if there are no dates for political office. However, this only happens in a few cases so I think if the people without dates for political office are just on the map and not the timeline, the overall trend of an increasing amount of black politicians in the region will still be shown.

While I have run into a few problems so far—particularly on the technical, formatting, and content fronts—I believe they are all issues which can be overcome with help as I move farther along on this project.

Mapping Decline: St. Louis and the American City

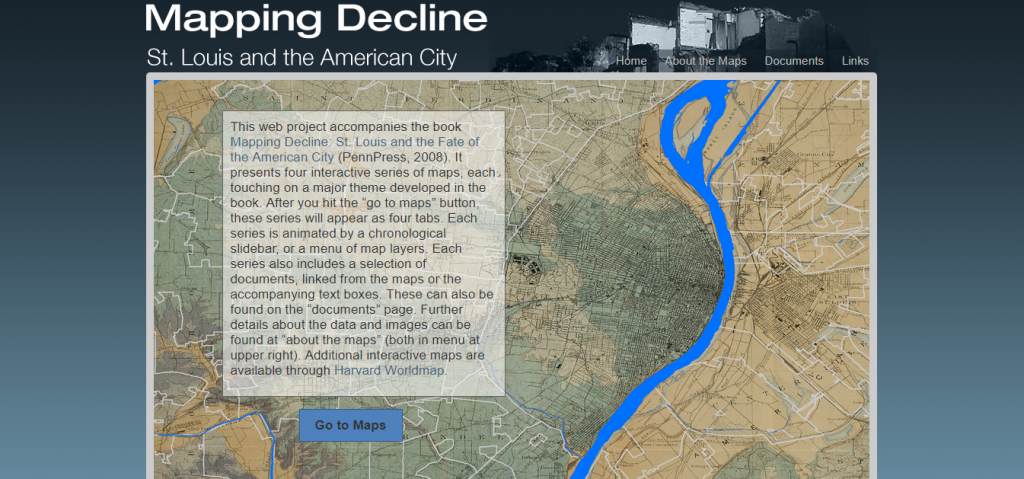
Mapping Decline: St. Louis and the American City is a digital mapping project connected to the book of the same name by Colin Gordon. This project uses various programs, particularly ArcGIS and Social Explorer, to explore the relationship between people and a place (a common theme in traditional humanities) interactively.

Home screen for Mapping Decline.

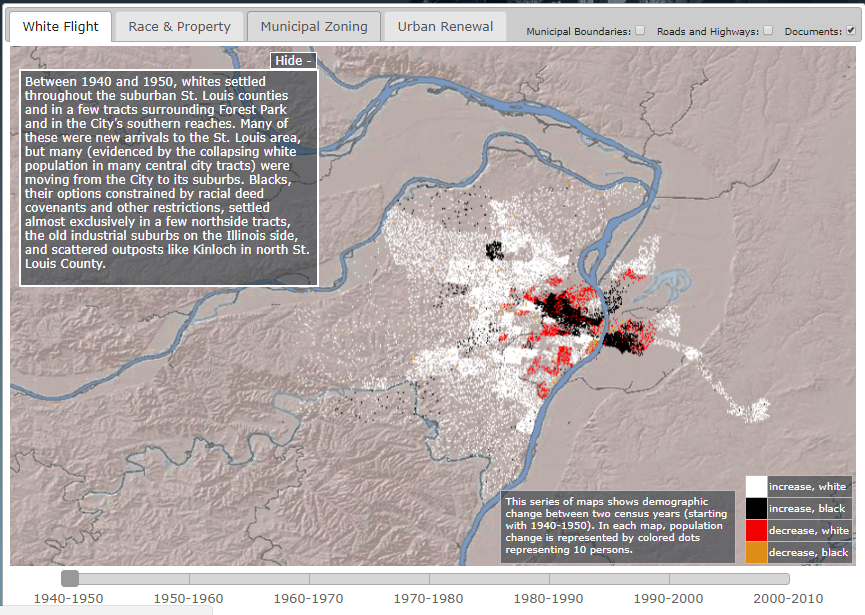
The project includes four maps, each connected to a theme from the book. It is not necessary to have read the book to understand these themes, as the site gives background information on each one. The book and digital project’s main goal is to explore certain demographics—in particular race and housing—in St. Louis over time. Mapping Decline specifically explores four themes: White Flight, Race and Property, Municipal Zoning, and Urban Renewal. Except for Race and Property, all maps include a slider bar in order for the user to see change in each topic over time. For example, the White Flight map includes four types of data: increase in white and black populations, and increase and decrease in white and black populations from 1940 to 2010. With the slider, the user can interact with the map and see the change in populations in certain regions for the specific time period.


Slider for the “White Flight” map.
 
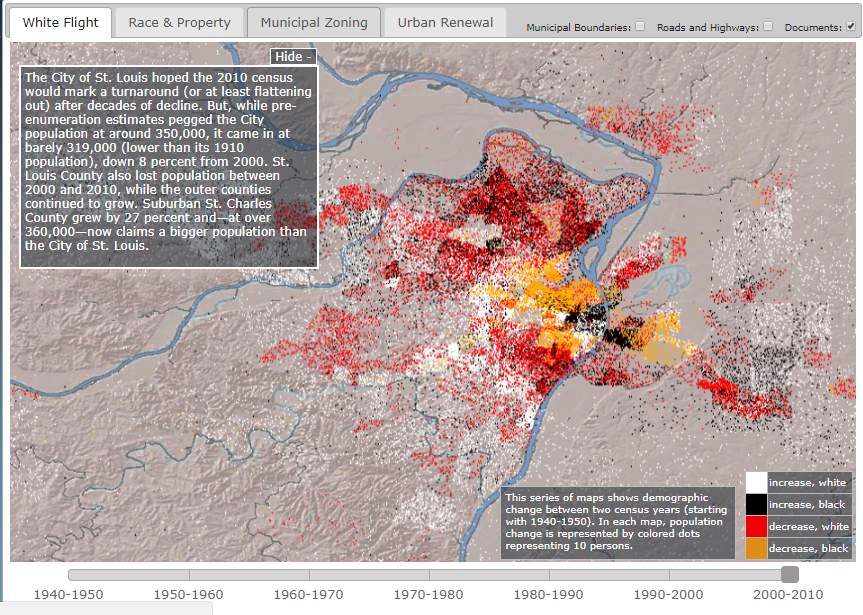
This interactive portion is one of the aspects that separates this from a traditional humanities project. Maps are often used in traditional humanities to illustrate certain concepts, particularly the relationship between people and places. Maps help the audience to visualize how a community interacts with its region. Digital maps, like those in Mapping Decline, have the added component of being interactive. Having the slider allows the user to flip between data from different time periods quickly. Seeing the data this way helps the audience to visualize the events, see patterns more easily, and bring the historical events to life.

Beginning and end time periods for the “White Flight” map.

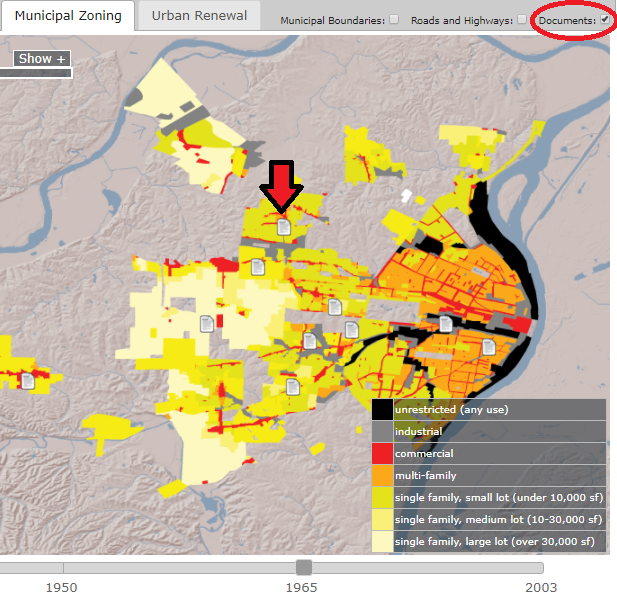
This project, since it is digital, can also reach a wider audience. One reason this project could reach a wider audience is because it is hosted on the Internet, which allows anyone with an Internet connection to access it. Another way this project could reach a wider audience is because, with it, Gordon can spread the message from his book in a condensed form. Instead of having to read the entire book, audiences can pretty clearly understand the ideas (or at least the data) Gordon covers in a much shorter amount of time. The project also includes links to documents which are important to the topic, something that is not offered by simply reading the book. In traditional humanities, you would have had to look up these documents on your own. Mapping Decline, however, allows you to access these documents with one click. A tab at the top of the site leads to a page talking about the documents, which includes links to digitized versions of the documents. Mapping Decline also offers the option of seeing the documents on the map itself. The user can turn on this option by clicking the “documents” button at the top. Once they are on the map, the user can get to the digitized version of the document by clicking the document symbols. Mapping Decline also has the option to enable municipal boundaries and roads and highways. Both by its location on the Internet and its form as a condensed version of Gordon’s book, Mapping Decline allows Gordon’s argument to reach a wider audience.

Example of documents inserted into the map.

Mapping Decline was created using a few different programs. From what I can find, Colin Gordon, the author of the associated book, did most of the work for this project himself. The three mains programs used were ArcGIS, Social Explorer, and the University of Minnesota’s National Historical Geographic Information System (NHGIS). The NHGIS is a place to find data in file types which can be utilized by GIS systems. The specific version of ArcGIS that was used was ArcView 9.2. ArcGIS is a mapping platform run through ESRI (Environmental Systems Research Institute). The ESRI was founded in 1969 and as of 2014, held approximately 43% of the GIS software market worldwide (more than any other supplier). The other mapping program used to create Mapping Decline was Social Explorer. Social Explorer is only one program offered by the company of the same name. Social Explorer the company has roots going back to the late 1990s and also offers the programs Charts, GeoBuffer, and MapSpice. Social Explorer includes some data access (like the NHGIS) as well as the tools to build maps. As mentioned in the “About” tab of Mapping Decline, some of the data had to be adjusted in order to be mapped. For example, the 1960 data (which had 323 census tracts) had to be adjusted to fit over the 1950 geography (which had 247 tracts) for the 1950-60 map.

Mapping Decline is an example of how interactive, digital maps can help an audience to better understand the patterns in data. Finding patterns in demographic data which relate to larger social issues in a community (such as housing and racism) is a popular theme in traditional humanities, but interactive maps on the Internet, using programs like ArcGIS and Social Explorer, allow for both a better visualization of these spatial patterns and a potentially wider audience.