Historical Homestead is an examination of the Wadsworth Homestead and its connection to larger historical contexts through the use of virtual reality technology.
Homepage:
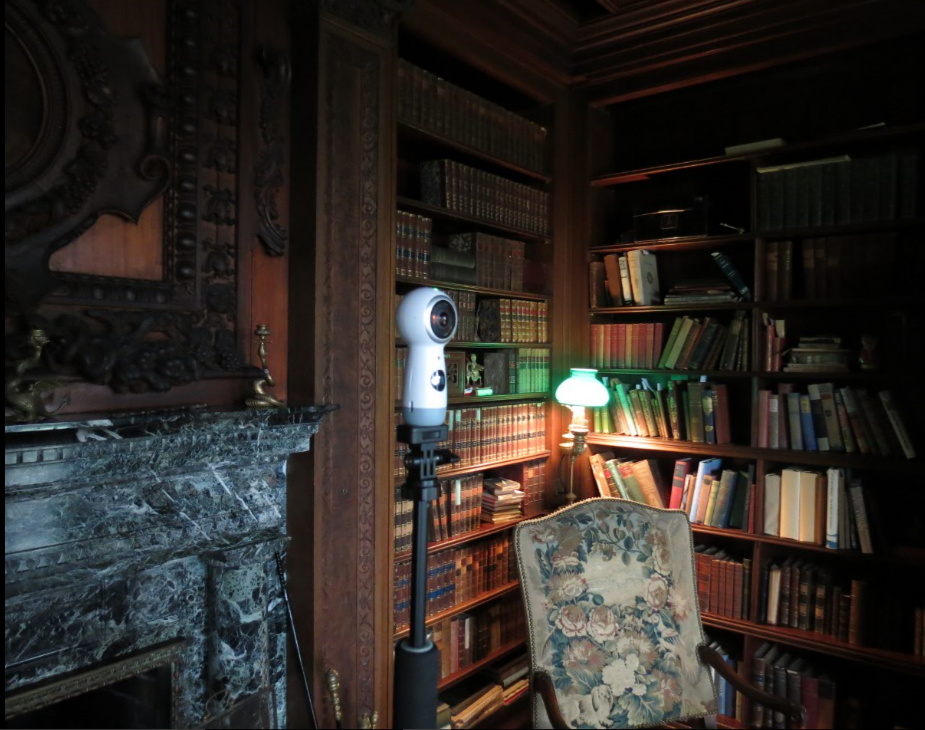
The opening page of the site presents a clear, organized format of pictures and text. The first thing one notices when visiting the site is the large circular pictures at the top. This was the original format the virtual reality “photos” came in, direct from the 360° camera’s two curved lenses. I thought this was both a beautiful picture of the inside of the Homestead, as well as a subtle introduction into the virtual reality (VR) process.
In the middle of the page, there is a block of text to provide context about the house and the Wadsworths to the viewer. This was taken from my essay on the house for my Museum Studies class. It introduces briefly the contents of the Homestead and why it is significant. The ending paragraph is the thesis of the entire site, written below:
Through virtual representations of the objects and rooms of the Wadsworth
Homestead, Historical Homestead aims to illustrate a larger connection between
the Wadsworth family and Geneseo, American, and global history.
The navigation bar at the top of the homepage was customized for this site. I felt the Omeka terms “collection” and “item” were confusing to use for this project. The items I cataloged for this project were in two groups, “Rooms” (such as the library and the dining room) and “Object” (such as a portrait on the wall of the dining room or a book on the shelf in the library). However, objects and rooms were both technically classified as “items” in Omeka. I thought this would create confusion, since the objects were stored physically in rooms and “item” seems like an odd term for a room. To avoid this issue, I redirected the “Browse Items” and “Browse Objects” tabs towards a “Rooms” page and an “Objects” page, and renamed them accordingly, as you can see below.

This reclassification on the homepage I feel solves the confusion of labeling and provides easier navigation throughout the site.
Virtual Tour:
The second link on the navigation bar, “Virtual Tour,” is the heart and soul of the entire project. This is where the aim of the project, illustrating a connection between the Homestead and larger historical events, is presented. As a visitor scrolls down the page, they are taken through a virtual tour of a selection of rooms from the Homestead. The rooms were specifically chosen for their ability to illustrate larger contexts of history.The layout of each section consists of an introduction to the specific room, the VR video-frame, followed by a list of the objects cataloged from that room. Each object is accompanied by a brief description of their significance.
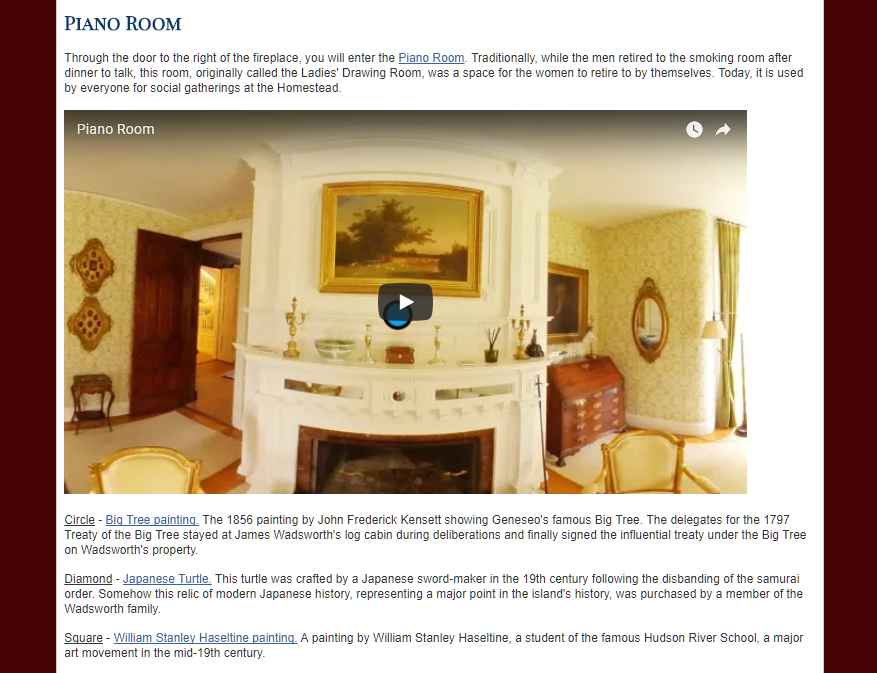
The VR video-frames are the most interesting part of the page. Hosted on YouTube, viewers can interact with the video and move the camera up, down, left, and right, as if they were looking around the actual room. Since they are hosted on YouTube, the video time will eventually run out. This is why I made them each one hour long, giving viewers plenty of time to explore without having to restart the video multiple times. The Piano Room’s VR is presented below as an example:
The blue shapes placed around the room are to highlight specific objects. I originally wanted clickable links embedded on the objects, instead of the shapes. Given the time frame of the project and our overall technological understanding, such a feature was out of the realm of possibility. Placing the shapes near the object instead, and using them to reference information below was the solution I felt was best. Each object’s description is accompanied with the link to its unique catalog page, where viewers can read more information about the piece. The brief description given on the Virtual Reality page is to illustrate the larger context in history between this object and the Wadsworths.
Overall, the Virtual Reality page came out wonderfully. There is an easy flow for users, as they scroll down through the rooms, or click to exterior links for more information. By the end of the tour, the reader will understand the larger connections between the Wadsworths and history.
Rooms and Objects:
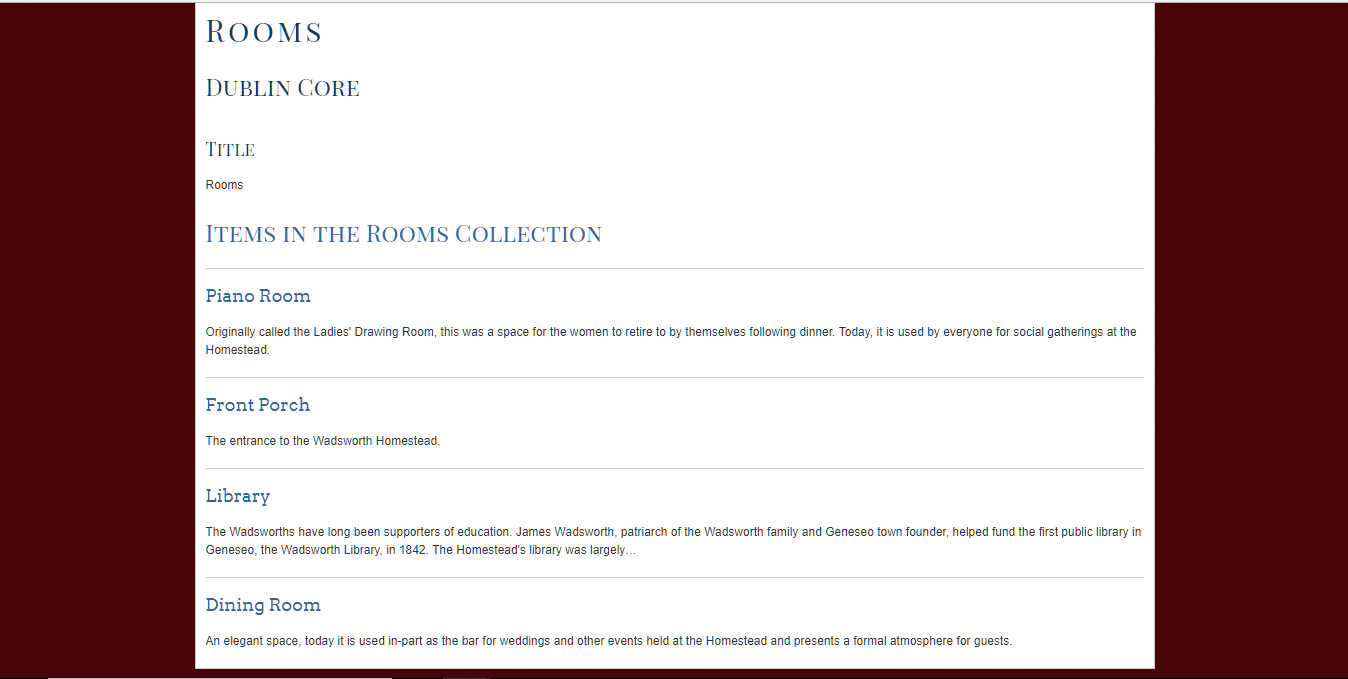
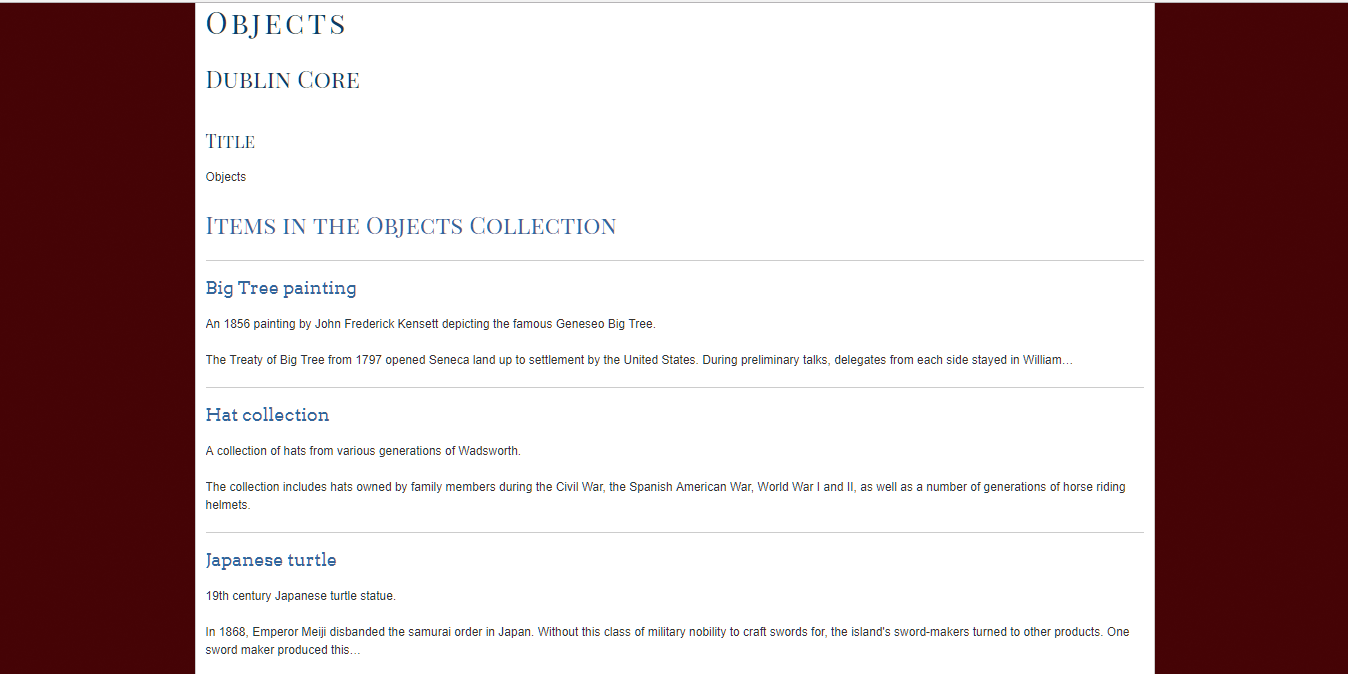
The final sections of the website present a grouping of all the rooms and a separate grouping of all the objects. These pages serve as catalogs for the items, where viewers can click and read more information about a specific room or object on their specific page. Each room or object page is linked to in the Virtual Tour, but these separate pages listing the items allow for quicker access to more information about the specific item, without the hassle of searching through the Virtual Tour.
Overall:
Historical Homestead, through its simple VR program and site layout, conveys to readers my thesis in an easy to navigate digital world. This is how the project captures elements from both traditional humanities work and digital humanities. Presenting a thesis and supporting that claim through evidence is what traditional historians do. My presentation of the rooms and objects in a virtual environment, while utilizing exterior source links, is the newer digital aspect of humanities work. I think we reached the goal of presenting the Homestead in a thorough manner and illustrating the family’s connection to larger historical events from the foundation of the Genesee Valley Hunt to imperial Japan. This is a much better result than the initial project of simply a VR tour of the Homestead. Using the VR to illustrate the deeper history of the Wadsworth Homestead produced a much better and more engaging project.