For my project I looked closely at the works of Thucydides and his historical depiction of the Peloponnesian War. I decided to use multiple different tools to create a more in depth analysis of the work and also to provide the reader with a better historical context of when each of the events described by Thucydides in the work happened in the timeline of the war. At first I was planning to just use Timeline JS on my project and provide a few different timelines that present the differences between the timeline of Thucydides’ work and the timeline of the actual war.
This proved to be insufficient in getting across all of the analyses I wanted to present in my project. Instead of doing this I met with Kirk and talked to him about organizing the mentions of people and locations in the book into pivot tables that showed the number of times each of these items were mentioned.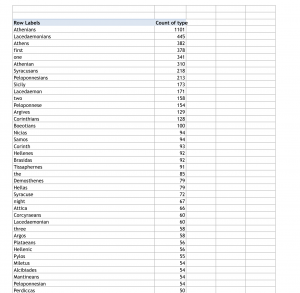 With Kirk’s help we used GoogleMaps to create two different maps showing the locations that were mentioned.
The darker dots show that that item was mentioned more in the works of Thucydides than the lighter dots are. Along with these maps I provided an analysis of the pivot tables, explaining possible explanations for why some items were mentioned more than other such as a possible bias that Thucydides may have had on the side of the Athenians. To bring all of these different elements together I decided to create a wordpress site. This site has a different page for each map and timeline and comes with an analysis of each one.
This project is different from a traditional humanities because it is interactive. The viewer of the site is able to interact with the timeline by clicking on the different events which will then give a detailed background on the event.
They are also able to click on a spot on the map and learn the number of times that the word is mentioned and where the most mentions were located geographically.
I learned a lot about numerous different tools used by digital humanists. I am glad I had the opportunity to use multiple tools instead of just one and I had a fun time trying to set up the website so that it would present all of the information in a comprehensive way.