Sandstone Trail Final Blog Post

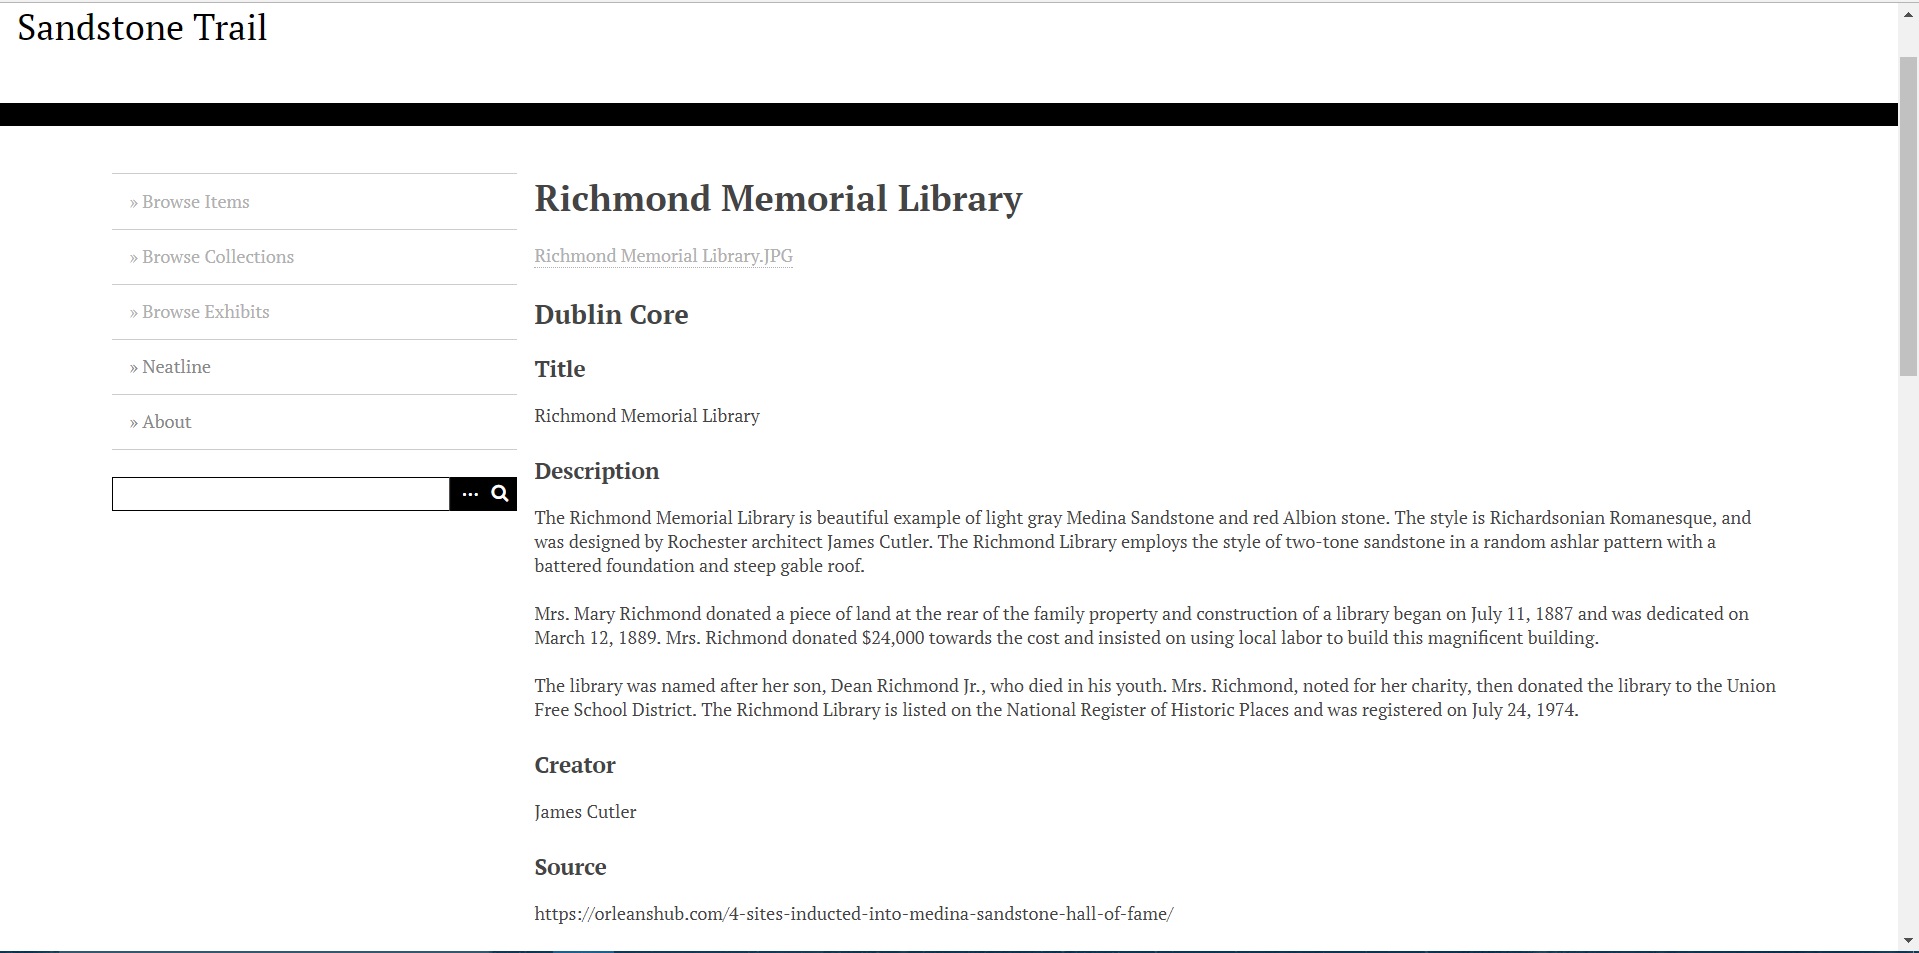
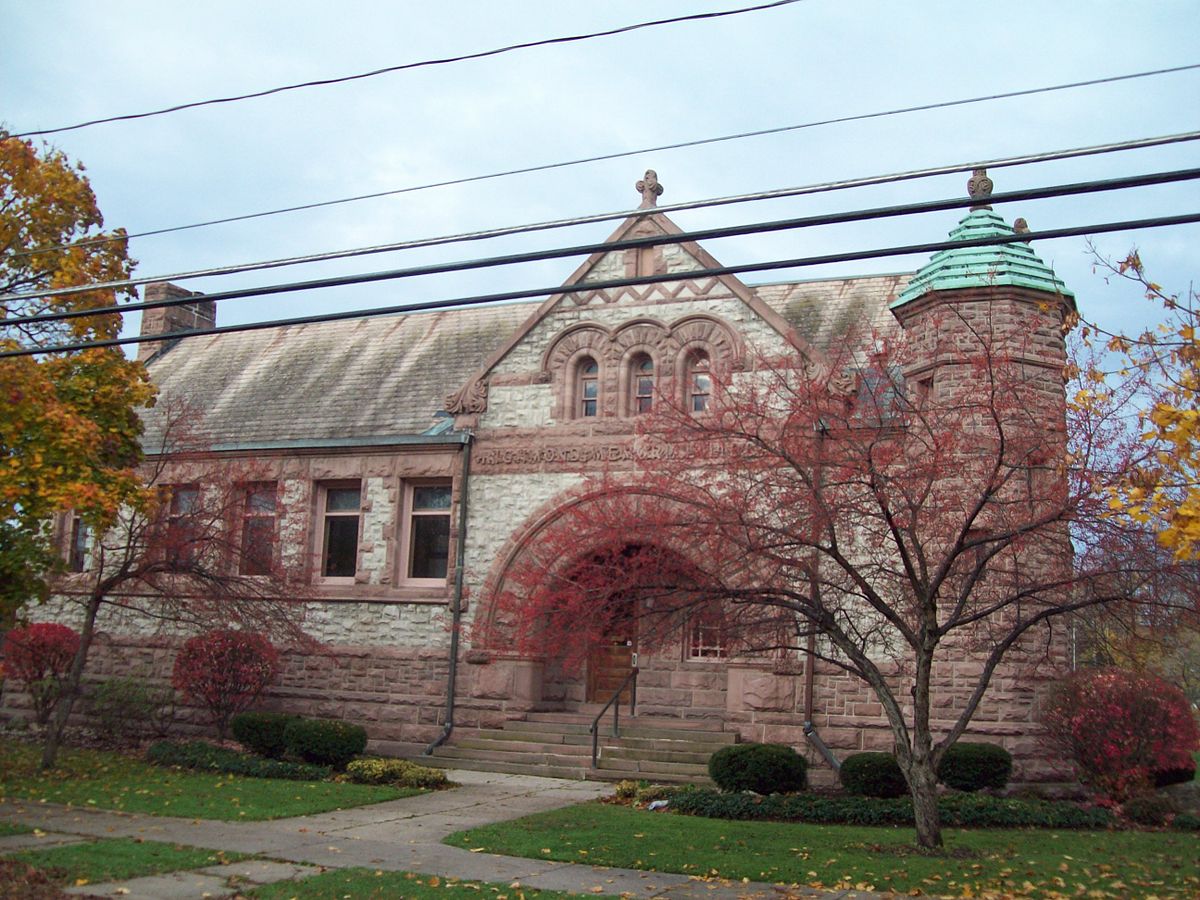
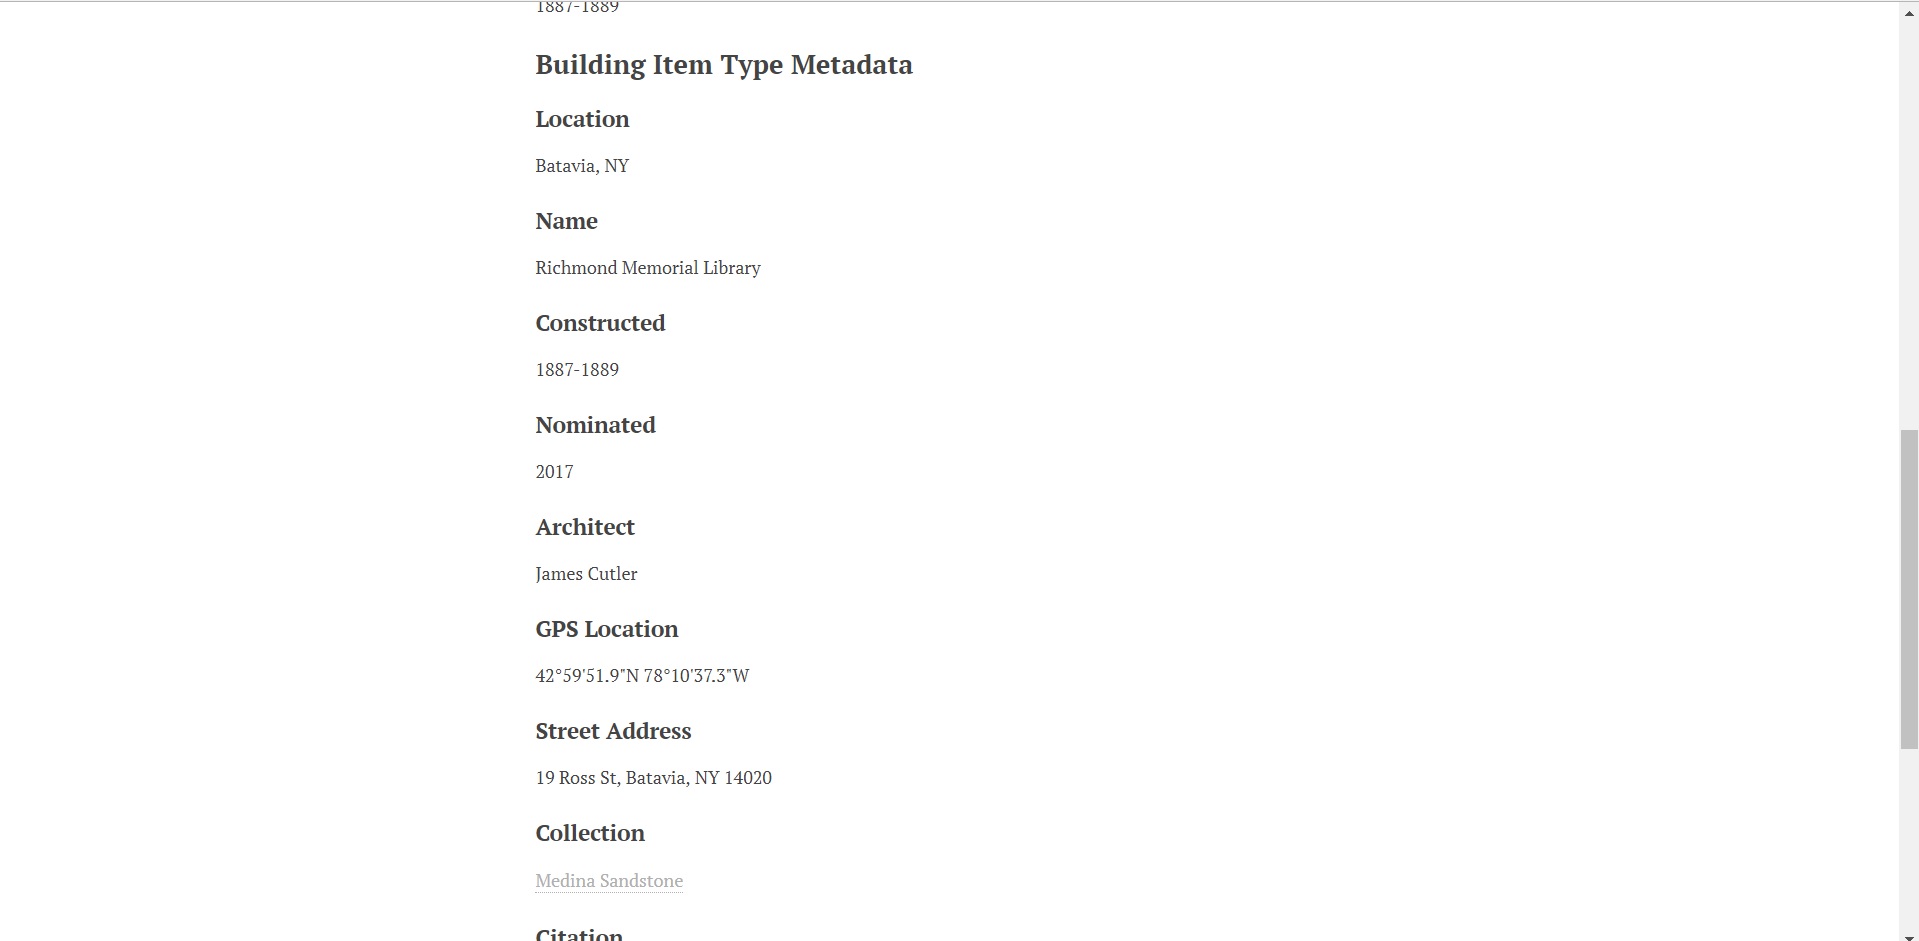
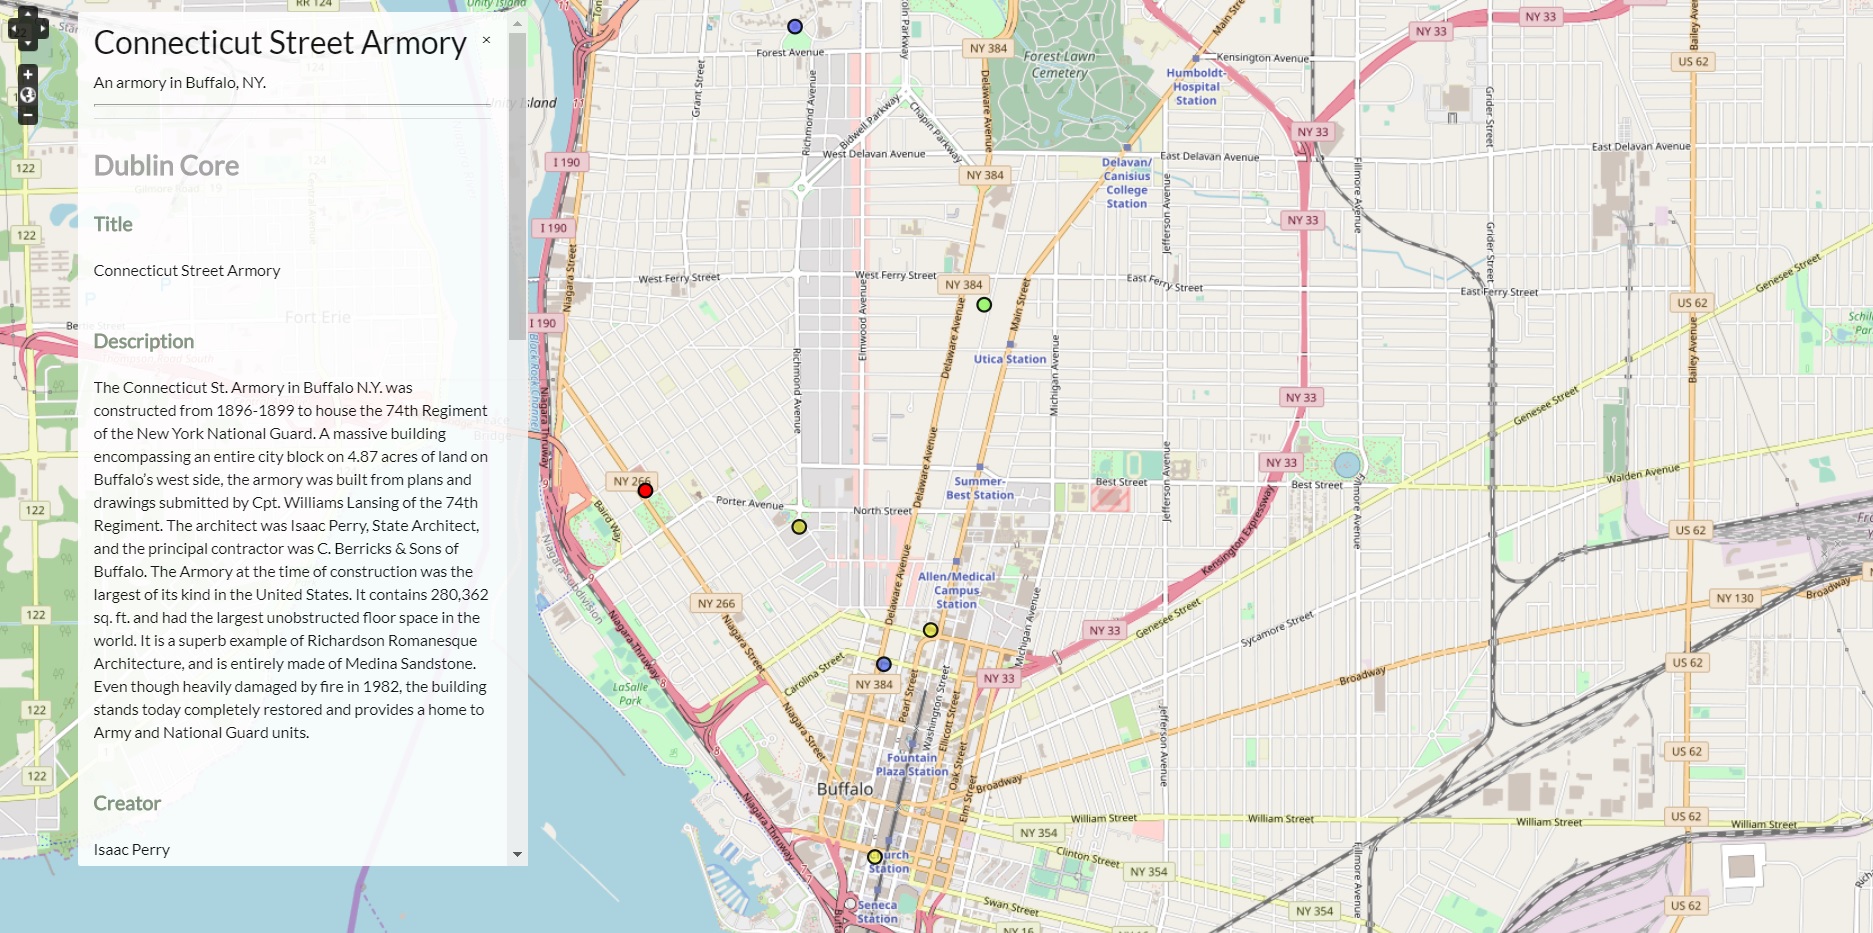
At long last, my digital humanities project, “The Sandstone Trail,” is complete. With it, I had set out to create an archive of noteworthy buildings that utilized the famed Medina Sandstone in New York. I wanted not only to organize an archive with key metadata, but to also provide a visualization of this information. This visualization is key, and differs from traditional humanities, because it captures the scope of how popular Medina Sandstone was. It is one thing to read that it was used across New York, but another to physically see the locations of the buildings, and what they look like. Each of the 21 buildings featured also include a brief history, as well as metadata that pertains to their location, architect, date of construction, function, and more. This information is easily accessed via the map by clicking on the locations, or through the “Browse Items” tab on the homepage. This archival method is superior to a traditional humanities method, because it provides an interface that allows users to search by tags, and links relevant metadata directly to the post, so that the user does not have to search elsewhere for it.


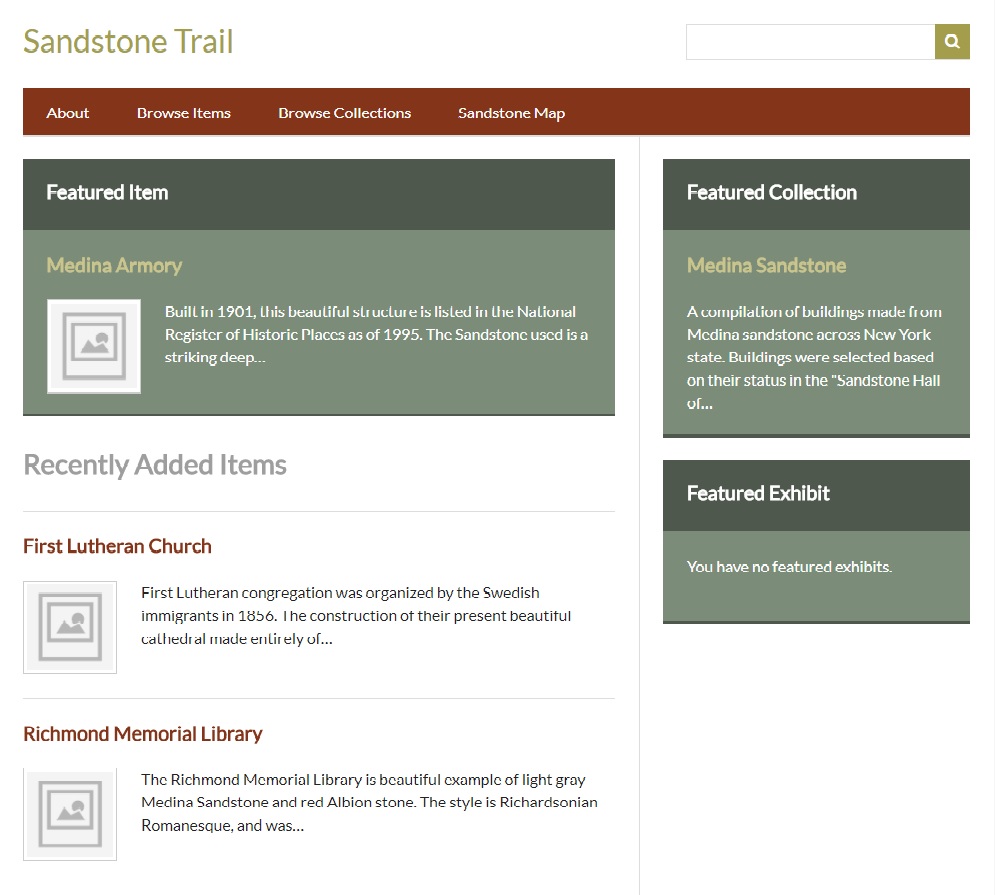
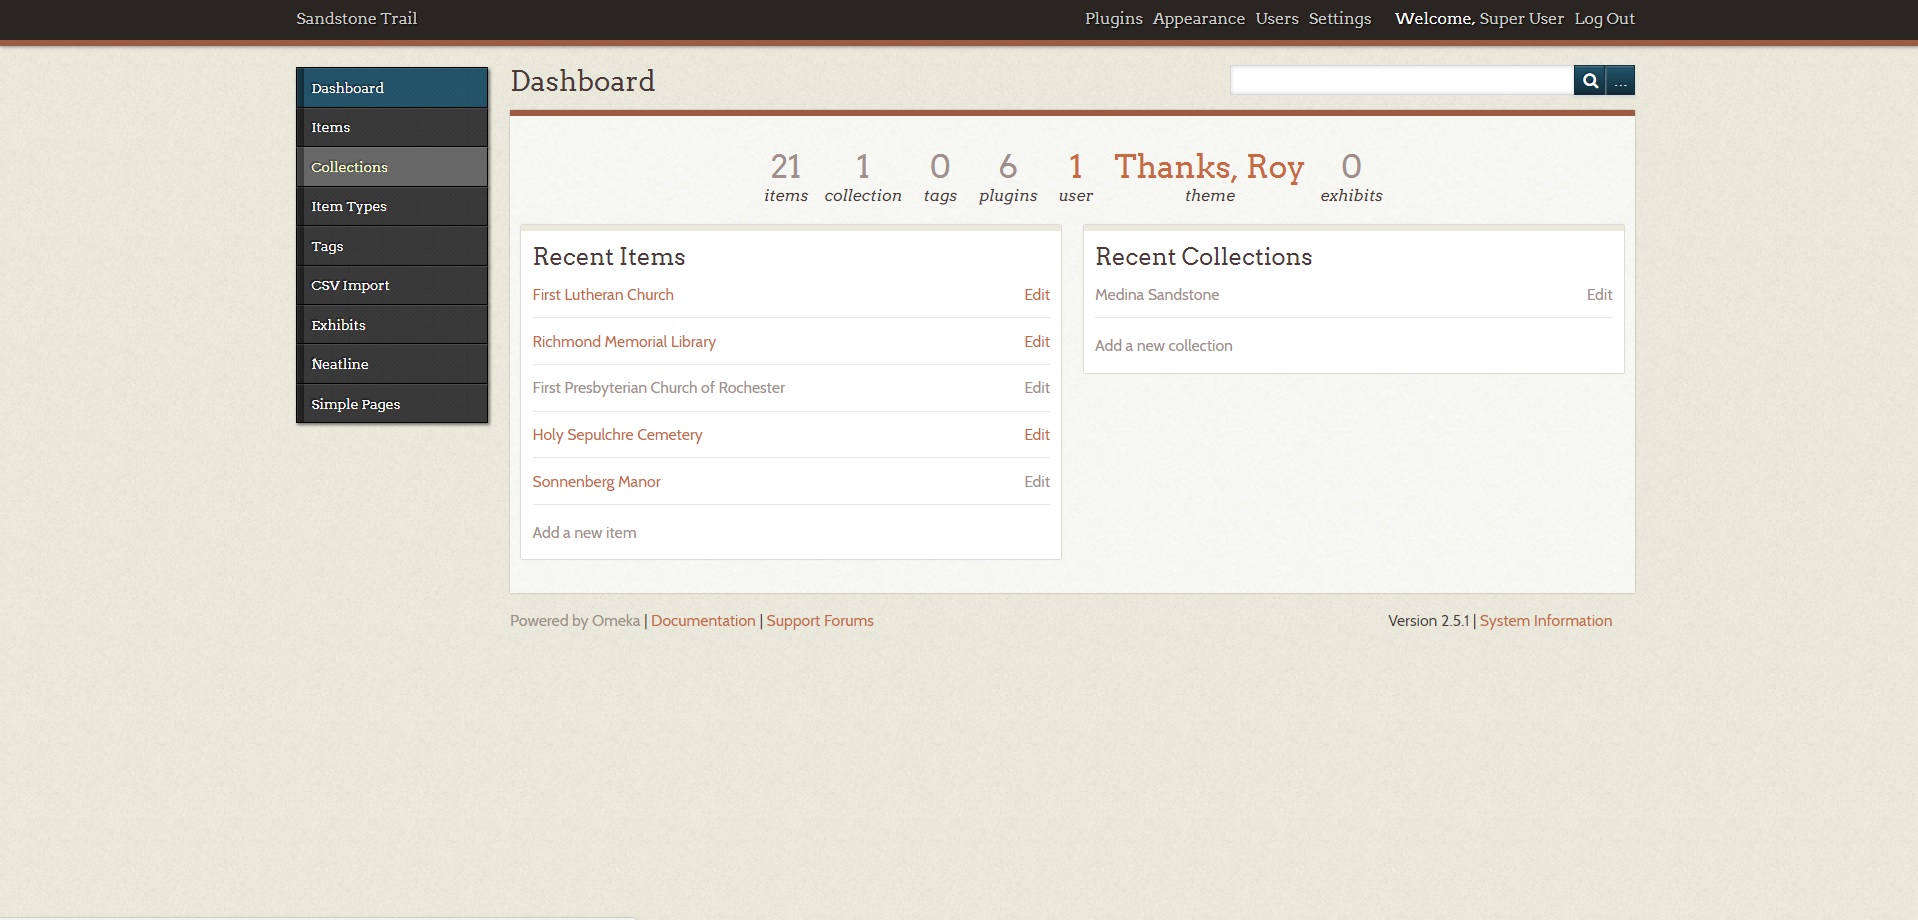
The site itself is also laid out to be very user friendly. Along the top are four tabs titled, “About,” “Browse Items,” “Browse Collections,” and “Sandstone Map.” The “About” tab includes some background on Medina Sandstone, and the relevance of the project. The “Browse Items” tab allows users to, as the name implies, browse the various buildings that are featured. Users may narrow their search by clicking on “Browse by Tag,” so that they may find buildings specific to one area, such as Buffalo or Rochester. “Browse Collections” includes the only collection that is available on the site, the “Medina Sandstone’ collection, which holds all the buildings. And last but not least is the “Sandstone Map,” which opens the Neatline powered map that enables users to go around New York State to look at the various buildings. From there, they can click on the numerous dots to view the history of the building, metadata, and a link to its page in the archive.


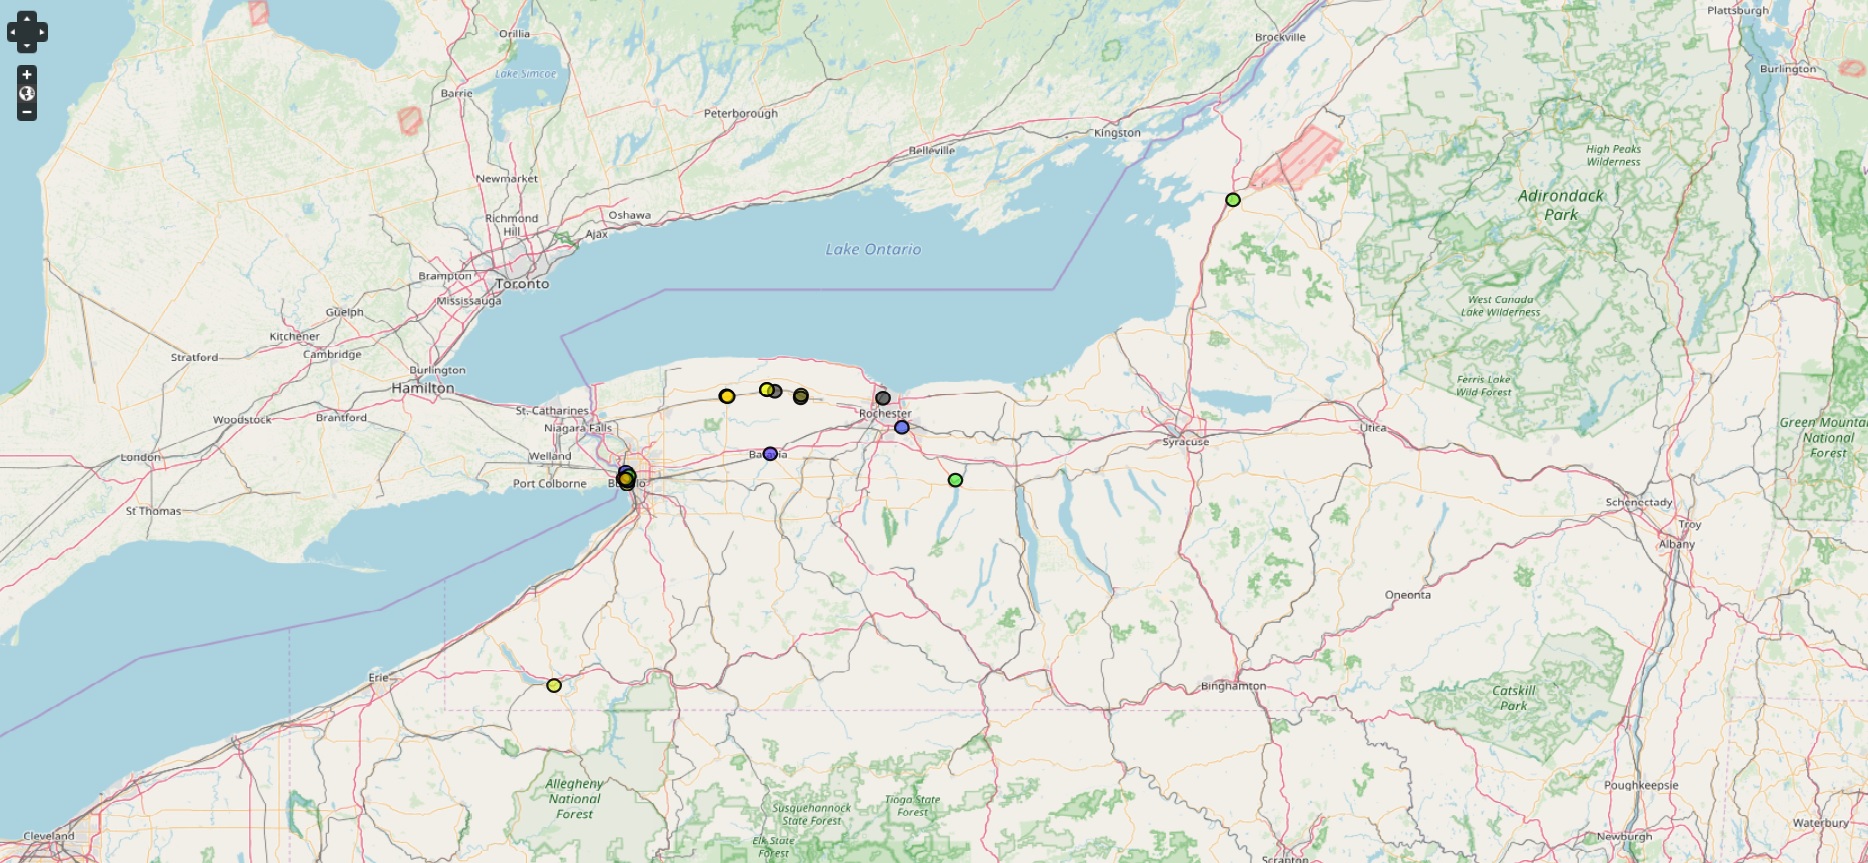
However, this progress was not achieved without some road bumps along the way. My initial problems were just getting Omeka to even run on my machine; thankfully, a trip to Dr. Kirk Anne was able to solve the issue. I had (and still have) problems getting ImageMagick to work, which would allow thumbnails of my images to appear on screen. Apparently, this is a Windows specific issue, which is unfortunate because it limits the aesthetic element of my project, but fortunately they can still be viewed, albeit not in a nicely formatted thumbnail. Adversity was also met in getting the Neatline map to function properly. Dr. Schacht and I were able to fix this, but even after leaping that hurdle, there came the problem of pinpointing the building locations. Unfortunately, Neatline does not follow the same coordinate language as Google Maps (where I pulled my information from) so I was not able to upload that and have a point placed on the map. Instead, I had to drop the pins for each building manually, and make approximations based off their location on Google Maps. It ended up working out fine in the end, but it was a very time-consuming process.

Overall, this project has allowed me to explore a method of presenting information that I would have thought impossible. In the case of my project, I have been able to represent an archive that would previously be represented only by text, and provide visual data to enhance the overall information that can be garnered. I was not well-versed in utilizing computer programs such as Omeka and MAMP, and now I not only know how to use them, but I understand just how beneficial they are in transcending the limitations of traditional humanities projects, so that they can become more accessible and informative.

Progress: Sandstone Trail

Finally, I’ve managed to get an instance of Omeka up and running, and have begun transcribing my information from my Excel spreadsheet to Omeka. The goal of my project is to still create an archive of buildings that use Medina Sandstone in New York, while also providing metadata such as their location, architect, construction year, etc. I’ve narrowed down the buildings to those that are in the “Sandstone Hall of Fame,” which was created by the Medina Sandstone Society. 

Despite prior problems with Omeka, the platform has proven to be quite accessible. It was very easy to upload my information on to the platform and create tags for metadata along with it. The difficulty now lies in getting the mapping plugin, Neatline, to create a map for the information I’ve uploaded. This map is central to my project, because it is what differentiates this information from its physical form, by providing a visual of the buildings and their relation to each other, and Medina. 

Once this visual portion is up and running, it will reveal some of the observations that I’ve already discovered through my work. For instance, the concentration of buildings decreases greatly as the distance from Medina increases. This raises interesting questions as to why this was. Perhaps transportation issues? Also, what was the primary transportation method for the sandstone? Another observation was that there weren’t any buildings in the list that were built past 1901. What is the reason for this? Did the sandstone industry see a decline during this time? Was there a lack of resources? Or maybe a lack of interest?

A limitation of Omeka that I’ve noticed is the inability to display an image right on the page of the item that is selected. This could just be due to a missing plugin, and the image can still be opened from the page, but it’s an aesthetic issue that does bother me. Another limitation is the lack of aesthetic options to change the style of the page. I’ve have to look more into this to see if I can find a cool theme. Another feature that does not seem to be present is a graphing function, so that I could display the frequency of the buildings that were constructed and when they were most/least popular. I’ll probably just end up creating that graph separately and uploading it individually. Lastly, the lack of functionality with Neatline is annoying, but hopefully Kirk will be able to find a solution, so that I may begin working on that aspect of my project.

Visualizing Emancipation

“Visualizing Emancipation” provides a detailed map of all known locations in the U.S. where a slave was emancipated in the Civil War era. This project in particular has benefited greatly from being created digitally, as it provides an interactive, simple to use interface for finding a plethora of information on emancipated slaves.

The project consists of a map with a number of red dots on it, each representing a location in which a slave was emancipated. In addition to the red dots are blue markers that represent the Union forces as they advanced through the confederacy.

These marks serve to show the relationship between the advancement of soldiers, and the increased emancipation rates.

The project’s goal is to provide a record of emancipations as they occurred throughout the U.S., while also providing a way to visual the location and frequency of these emancipations. The project advances the humanities work of organizing cultural events, analyzing historical events, and exploring relationships between events and places. The project advances a traditional humanities aim because the digital interface of the project allows the information to be organized in a way that is much easier to read and get access to. Rather than looking through numerous books to find emancipation records, you can just click on a dot on the map and it’s right there. The project utilized XML encoding, javascript, OpenLayers, and GeoServer.

While it is impossible to fully capture every single act of emancipation that occurred throughout the time period, the project does an effective job in displaying the information in an easy to understand manner, that is packed full of information on the events.