Time and time again, I have learned the lesson that I really should revise everything I write, whether it be this blogpost, an intense research paper, an email, or even a simple text. Obviously, I do not need to revise a text anywhere near the extensive revisions I use for a research paper. I use different revision techniques depending on what I am writing. With texts, I simply read them once over, edit the parts that sound unclear, check to make sure the recipient is correct, and send it on its way. The horror of sending a text that comes across as distasteful is only second to sending a text meant for my friend, to my unsuspecting mother! Sadly, Apple hasn’t created an un-send button yet. For emails and blogposts such as this one, I type them up in a Microsoft Word document first. I then make grammatical corrections and reread it to make sure there are no mistakes in the content of my email. A copy and paste later, and it’s good to go. Unfortunately, I failed to revise an email once, and instead of addressing a college coach who was recruiting me with the title “Coach,” followed by his last name, I instead sent “Coach” followed up by the name of the college. Needless to say, “Coach Vassar” did not reply to my email. When it comes to longer pieces such as essays and research papers, my revision process is a lot more intense. I always create a rough draft first, with a piece of paper and a pencil. Once the entire rough draft is complete, I normally have a peer or my mother read it over to check for grammatical errors and phrasing that doesn’t flow. After that, I type up my piece, editing and rephrasing sentences as I go. I read this draft aloud to myself to make sure I like how my ideas come across. It also helps me to notice if I used an incorrect homonym or left out a word. If you hear me talking to myself in the library, I promise I’m not crazy! Once I’m done reading it on my screen, I print it out, reread it one last time, and if it is to my satisfaction, I consider it my final copy. While revision can be very time consuming for me, I have only ever regretted not revising my writing.
Growing up, you could always find me with my nose in a book. Yet, it never occurred to me to write in those books; I never had a reason to use the margins to annotate and analyze anything I was reading, and quite frankly I didn’t want to. As someone who constantly overanalyzes everything, I enjoyed the fact that books were the one thing I didn’t feel I had to analyze. This began to change in middle school, when analyzing books so unfortunately became part of my grade.
From middle school onward, most of my English classes seemed to revolve around annotating different works of literature, whether it be a poem, a piece of fiction, a nonfiction article, or in one somewhat odd case, a nutrition facts label. When my teacher taught my class about annotating, we learned the GRAM method. With the GRAM method, I also learned a strong dislike for marginalia. For each new page of writing, I was taught to “Give a statement,” “Restate an idea,” “Ask a question,” and “Make a connection.” All this mundane annotating took place on photocopied pieces of each work, in pencil, and was always turned in for a grade.
Now that I am no longer “forced” to annotate what I read, I realize that all that practice writing marginalia was not for nothing. While I do not annotate works of fiction any longer, I do dog ear pages throughout the books I read that contain information I may want to refer to later in the book. In regard to readings for class, I do my fair share of marking up the text. I’ll print myself a copy of the text and proceed to highlight key themes, draw arrows connecting ideas to supporting evidence, and ironically, I still use the GRAM method in the margins, although they now go much more in depth than the superficial GRAMS I use to do for a grade. These annotations I keep solely for myself, mainly to keep up the façade that I still strongly dislike annotating (not really). In reality, I think everyone should have their own annotations because each work can be interpreted differently by different people.
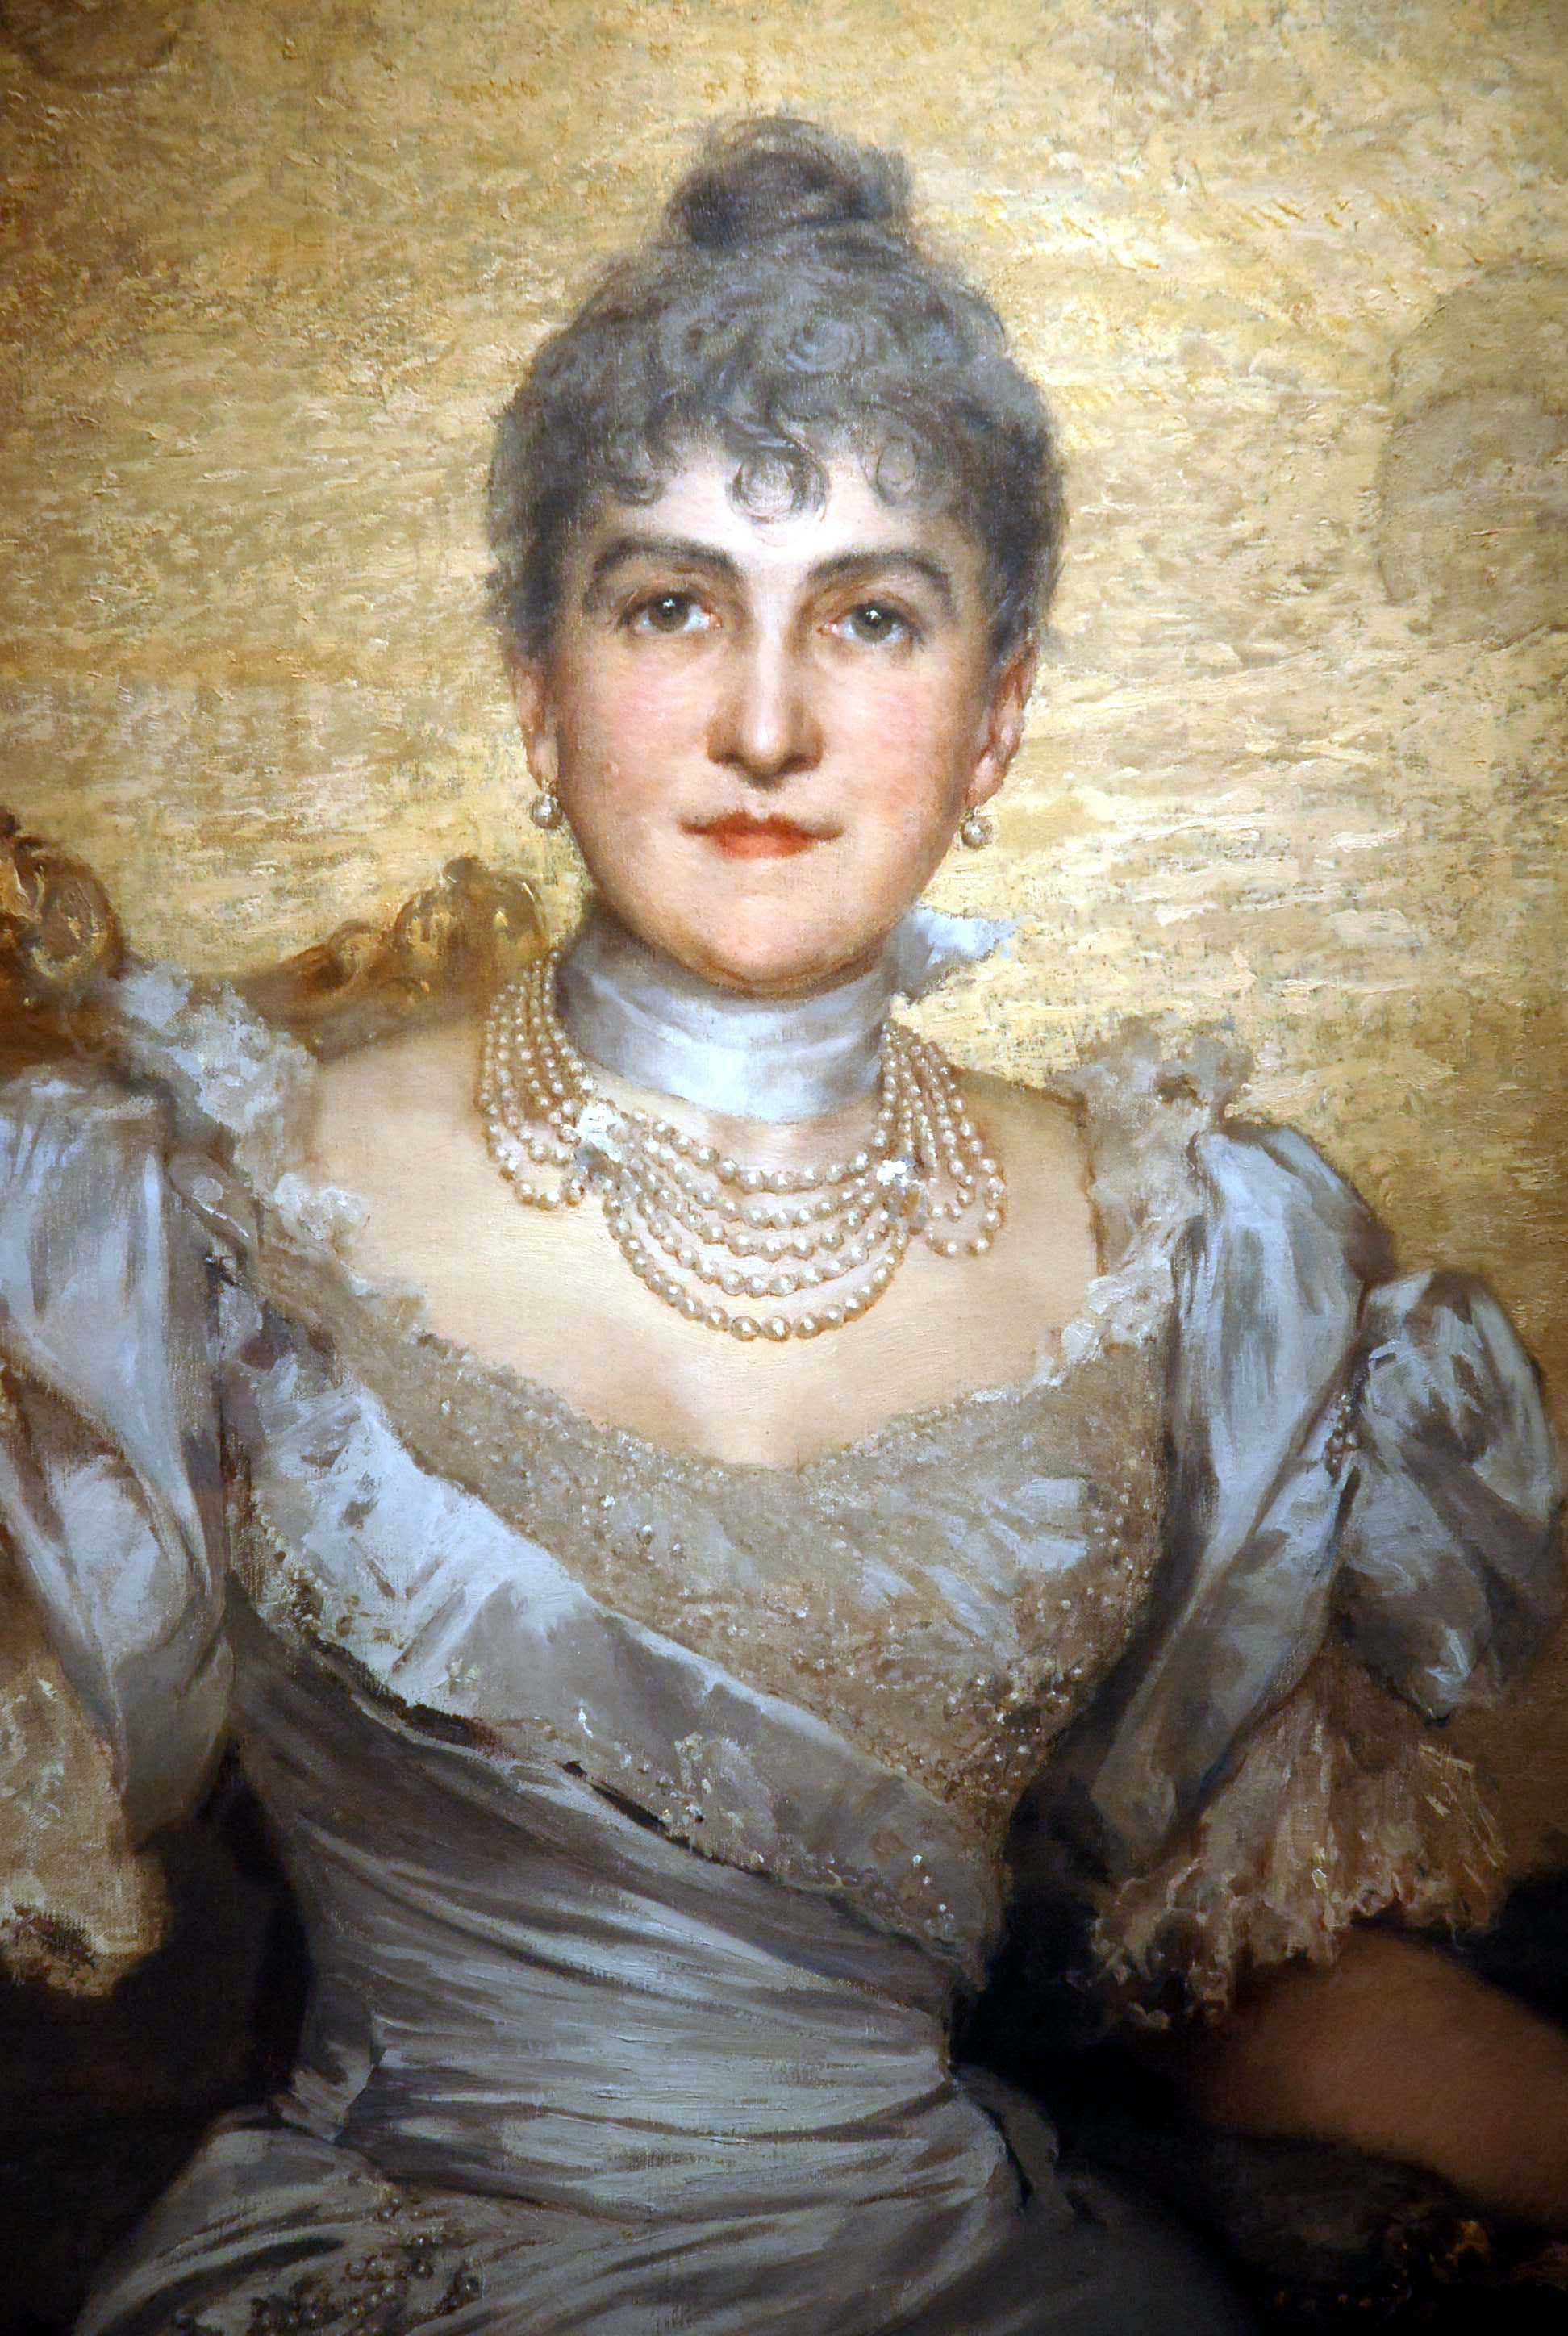
My project aims to create a digital biography/storymap of Cornelia Wadsworth Ritchie Adair (1837-1921), a pioneer originally from Geneseo, New York who played a substantial role in land development in Donegal, Ireland, and Southwest Texas. After her marriage to notorious Irish landowner John George Adair, Cornelia managed their estate at Glenveagh and was the primary manager of the JA Ranch in Texas, which at its height consisted of 500,000 acres primarily used for cattle grazing. Following the 1916 Easter Rising, Cornelia fled Glenveagh and devoted her time to land expansion in Texas.
Considerable primary and secondary source material exists on Cornelia Adair because her life intersected with many developing narratives of the late 19th century–including Irish land wars, the Easter Rising, Native American land relations, early environmentalist practices and Republican philanthropy. However, I wanted to organize and compile these sources into one website that focuses a narrative on Cornelia Adair, with a particular focus on the way Adair transformed spaces with an eye towards community development. As such, I decided to organize available primary documents and existing research on the Adairs into a biographical story map, which provides a spatial lens for assessing Cornelia Adair’s extensive travels and proto-environmentalist land practices.
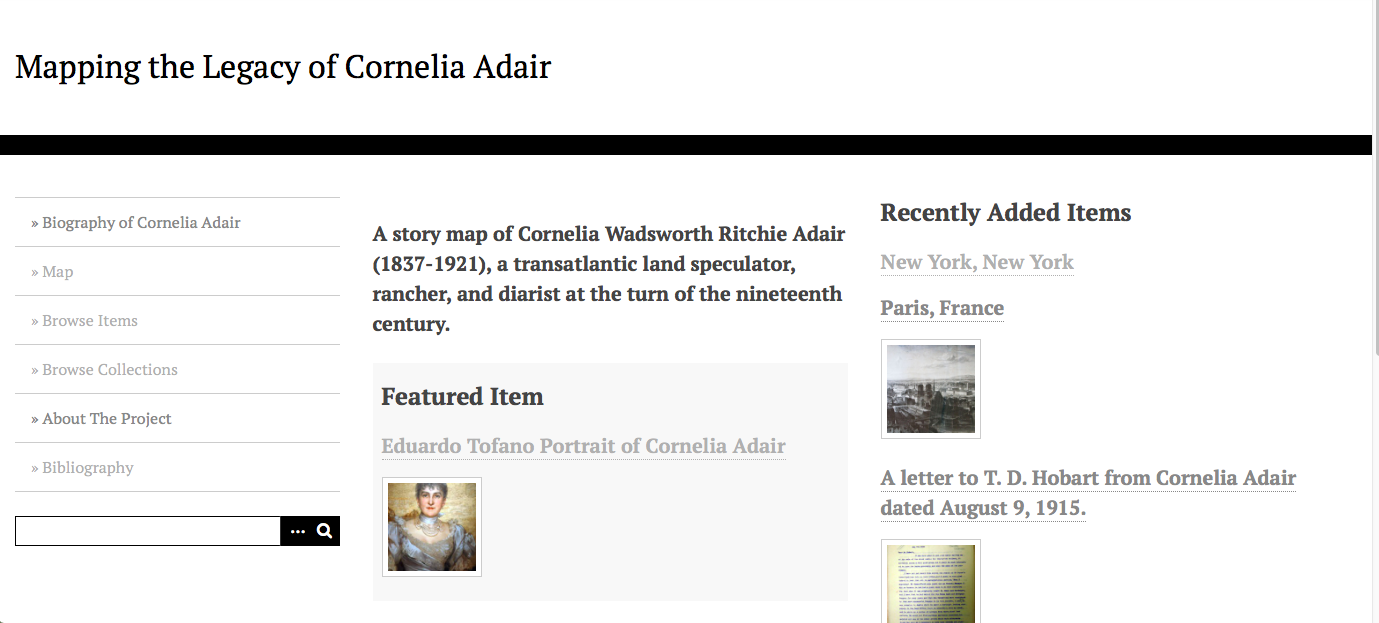
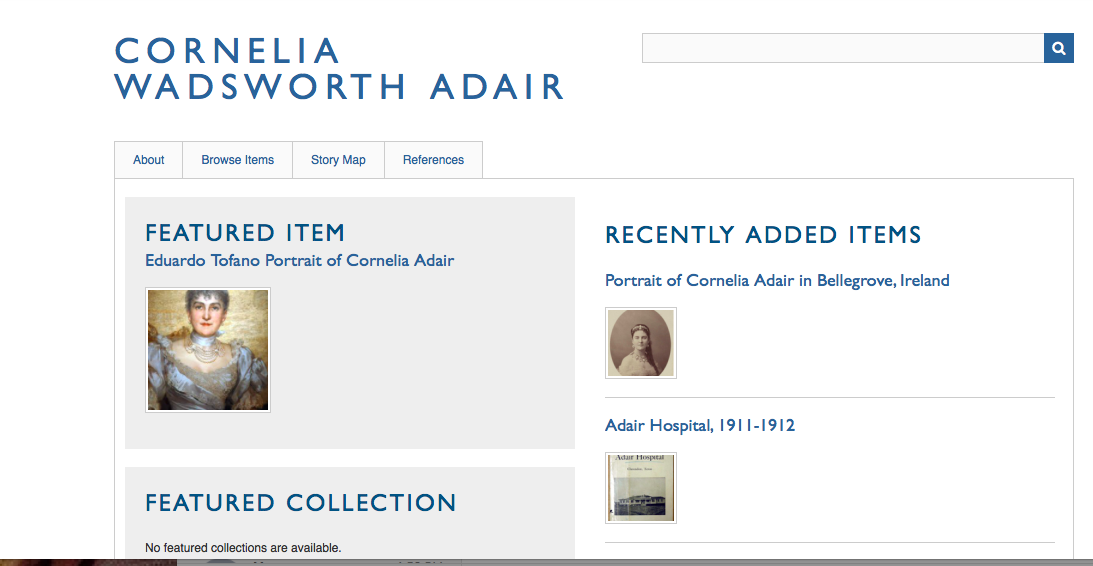
the homepage of my website
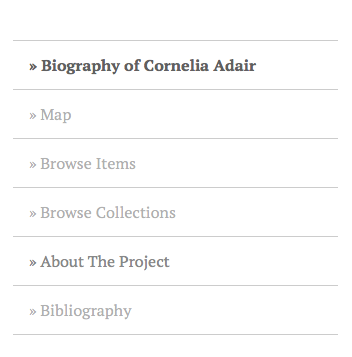
Before beginning the digital map, though, I had to develop a homepage and subsequent pages that would contextualize Adair and provide users with a fuller description of her biographical legacy. I used Omeka, an open-source digital archivist platform, to create “items” related to Adair, most of which contained a picture, source/publishing rights information, and several sentences of description to explain how that particular item connects to Adair’s larger narrative story. I also added three simple pages to the navigator of my site: a biography page, in which I provided a short (~750 word) biography of Adair; a bibliography to aggregate my sources and provide users with further reading material; and an “about the project page.” In this last page, I state the goals of my website, its origins in my research grant from the Geneseo Foundation, the digital platforms I used to make the site, and an acknowledgement to the folks who helped me in my research (including Dr. Schacht, Dr. Anne, Warren Stricker, and Sean O’Gaoithin). I also organized my items into collections, so users can quickly browse collections such as “pictures of Cornelia Adair” or “letters from Cornelia Adair” without combing through the map.
the navigation bar of my website
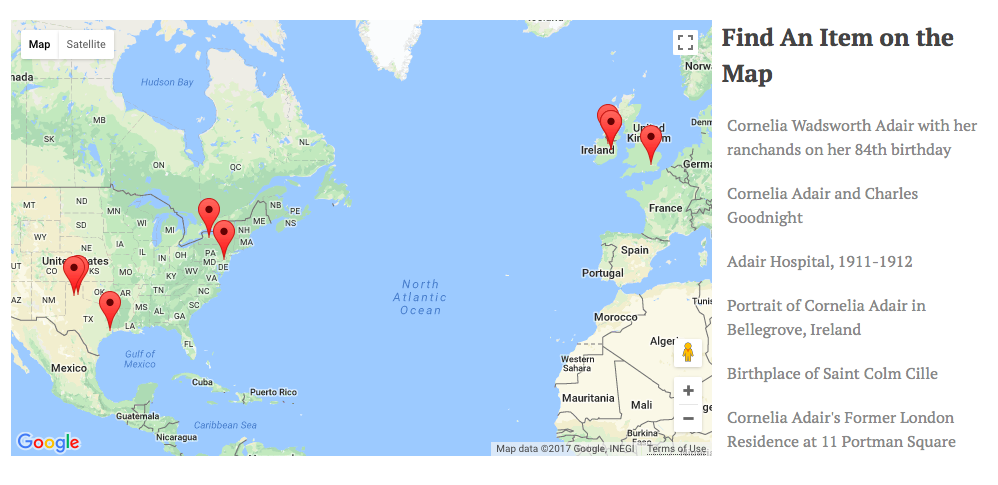
Finally, after adding the appropriate biographical and contextual information onto the site, I began developing my original aim for the project: a digital storymap. I used the Omeka plugin Geolocation to locate each of my items to a specific point on a map. From there, I was able to create a more holistic, spatial representation of the scope of Cornelia Adair’s travel and activities. Users can browse the map to find items, or zoom in to read about the legacy of Cornelia Adair at a particular place.
Map of Cornelia Adair’s Legacy
This is just one example of many forms of storymaps (I wrote about an earlier one that examines Yeats’s legacy created by the National Library of Ireland), but in general, I feel that my project helps build onto Cornelia Adair’s biography by showing how her activity connects to particular spaces. For visual and spatial learners, maps are often a critical way to transmit stories, which is what I sought out to accomplish in this project. However, the “about” section and “browse items/collections” feature of my website allows users who learn textually to explore the same content outside the confines of a map.
There are still many directions for me to expand upon my website on Cornelia Adair. For one thing, I’d like to incorporate photographs I’ve seen of Ireland’s land surveys of Glenveagh castle from before and after Cornelia’s time there, because these maps illuminate how Cornelia built and transformed a physical place, one that now operates as a national park in Donegal. I also want to add an audio recording of an interview I conducted with Sean O’Gaoithin, the head gardener of Glenveagh National Park (Sean has researched Cornelia’s influence extensively). For now, though, I’m happy with the outcome of my project, and satisfied with the ways Omeka and Geolocation enabled me to visually tell a story that compiles a wide range of resources from various locations. The tool (or really, set of tools) is an excellent platform to expand upon the traditional practice of archiving and categorizing historical information to convey broader narratives.
Final presentations in ENGL/INTD 388 Digital Methods for Humanists will be streamed live via Google Hangouts on Air from approximately 3:30 pm till approximately 6:40 pm on Thursday, December 14.
Update: The live stream is no longer available, but you can watch a recording of the presentations right here or on . See below for a breakdown of start times by presenter.
Initially, I was hesitant to use Omeka, because I felt out of my element in navigating the program and struggled to do basic tasks (e.g., creating a simple wepbage and putting it on my home site). But after playing around with it for the better part of two weeks, I’ve grown to appreciate how powerful the program is (especially in connection to project-related plugins, like Neatline). I’ve gotten more confident navigating my website and adding/categorizing items to my exhibit on Cornelia Adair. Currently, my homepage looks like this:
As you can probably infer, I have some major work to do–for one thing, I need to type out an introduction (re: the “about” section) that outlines Cornelia Adair’s biographical context and significance. Right now, my next big task is to get familiar with Neatline. Although I can link the items I’ve created in Omeka to records on Neatline, I’m struggling to pinpoint the Neatline records to specific locations on a map (I had thought it would be as easy as typing in locations on a search engine, but alas….). Given that the bulk of my project focuses on mapping out biographical information to tell a story about Adair’s connection to geographic spaces, I need to develop the map on Neatline or consider using a different plugin.
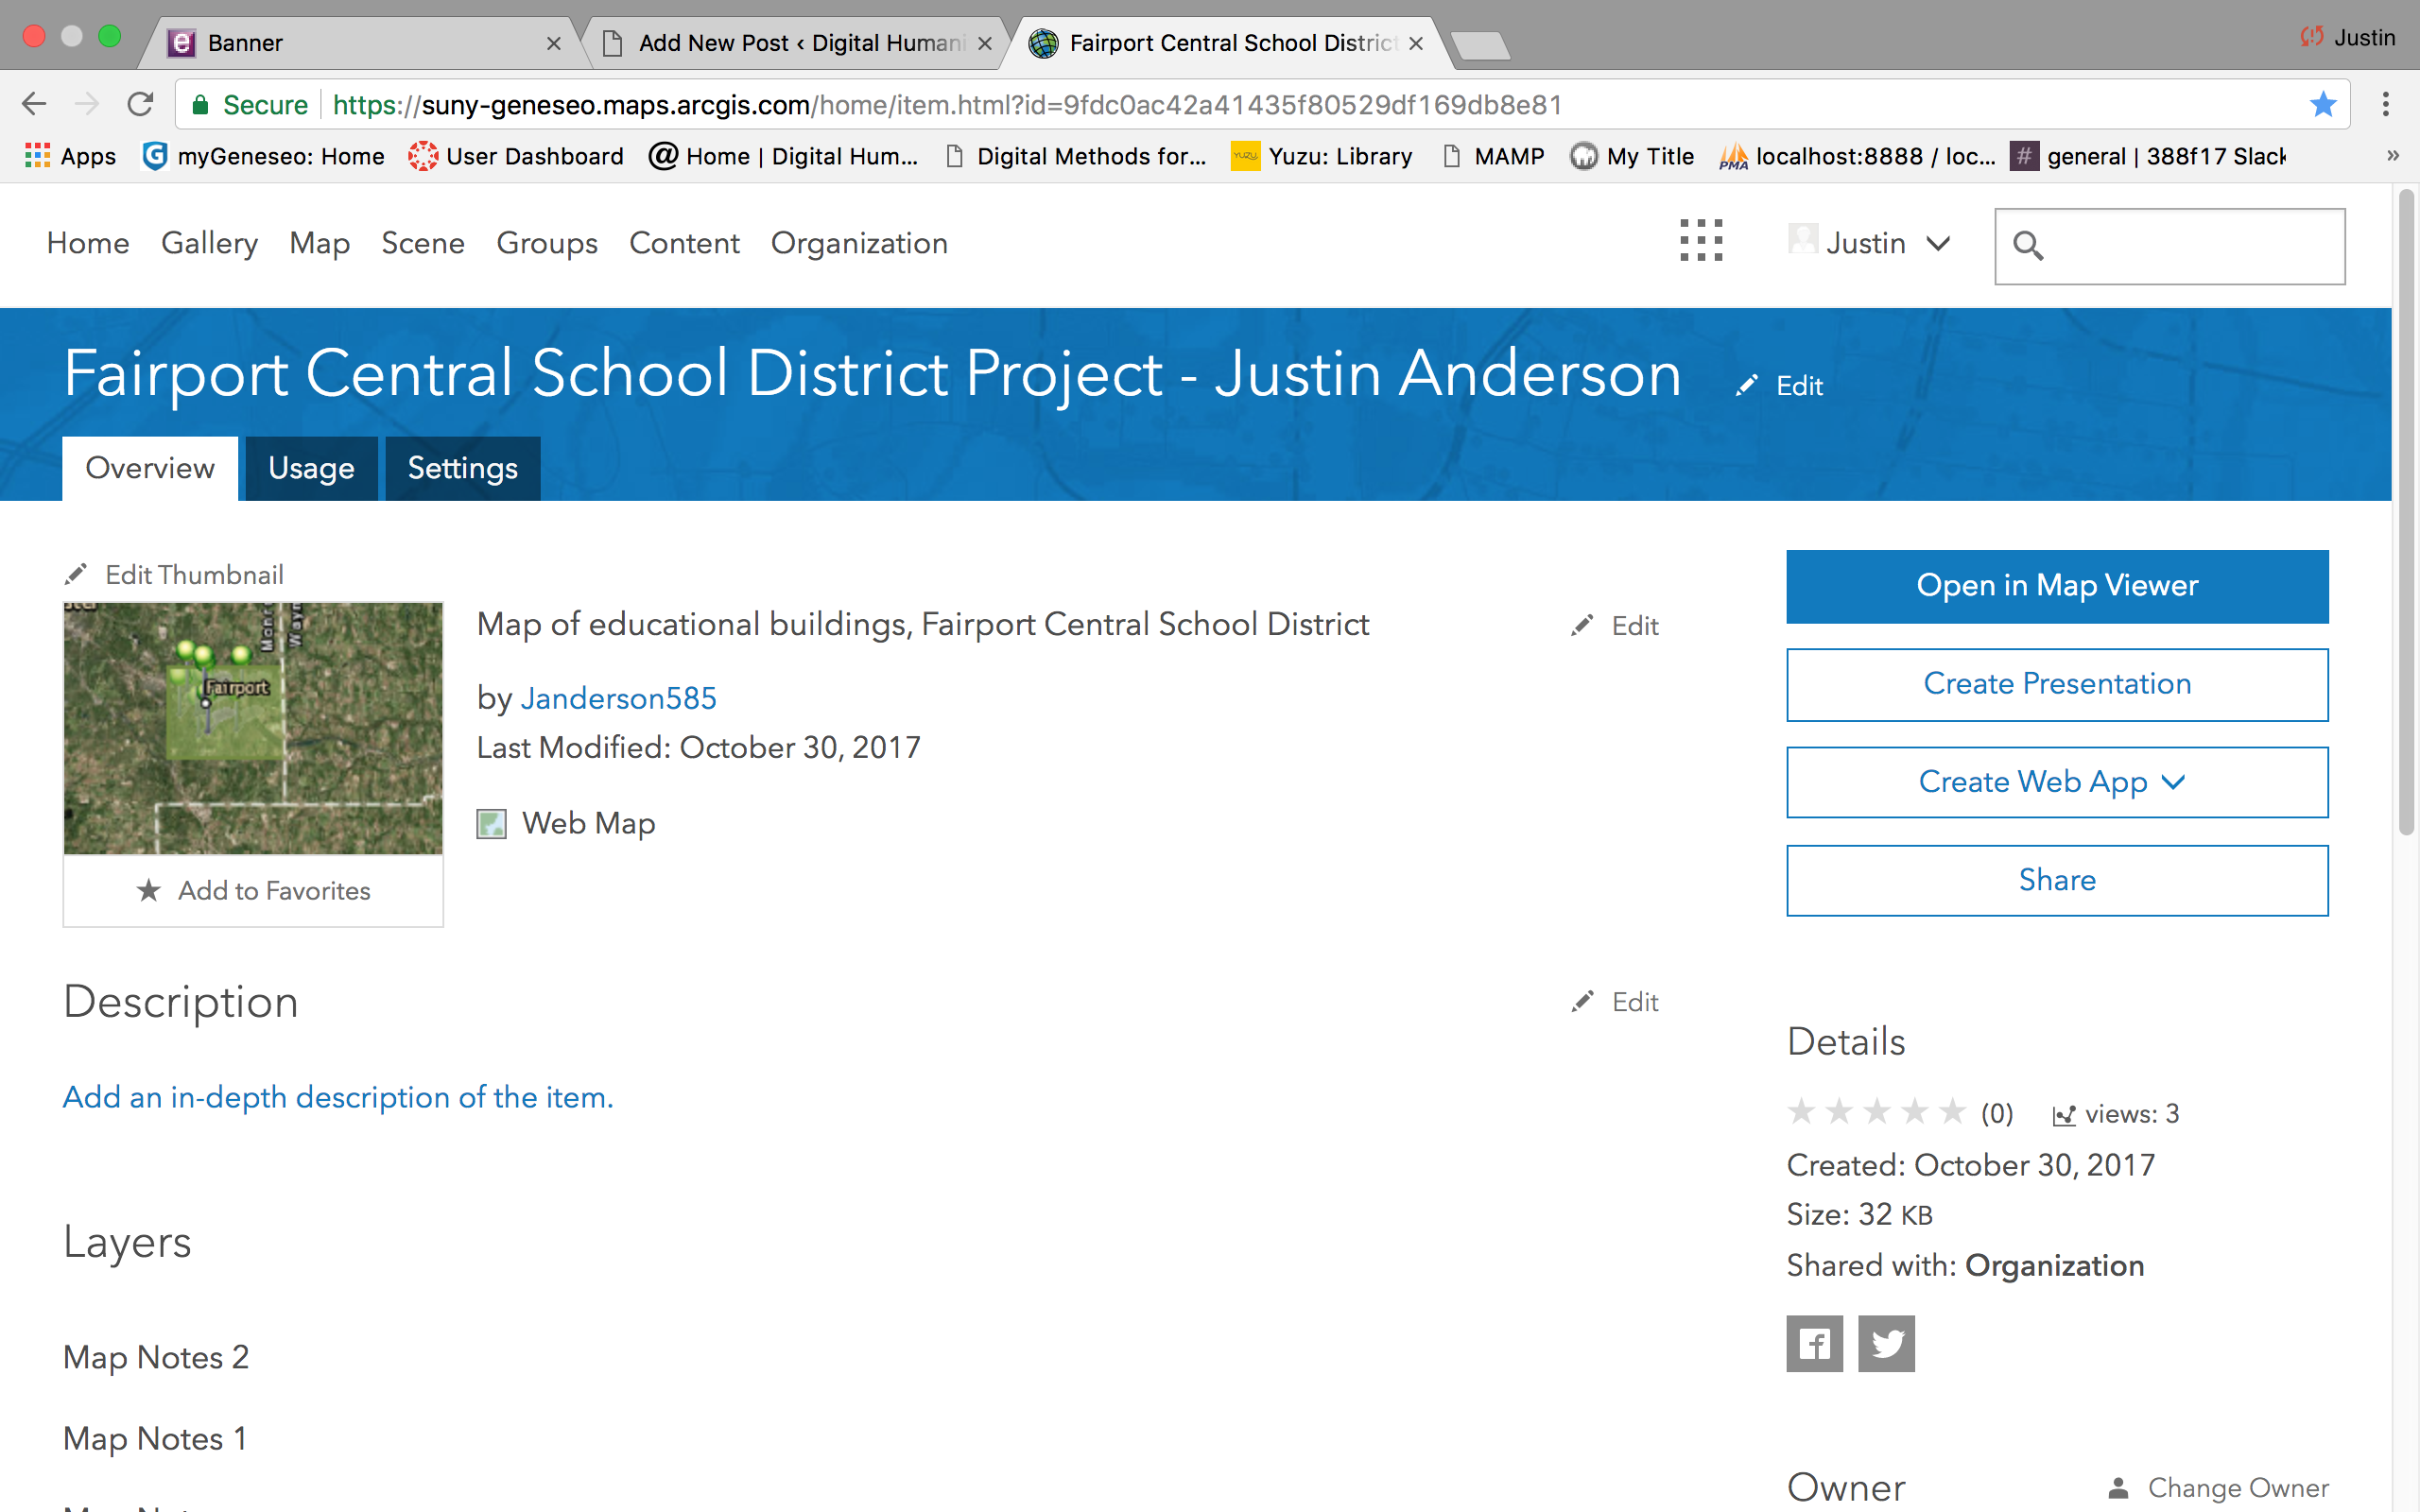
My DH project is interconnected with my research in Dr. Steet’s INTD 203: Social Foundations of American Education. I am looking into the impact of the Erie Canal’s construction on population redistribution in Western New York. Specifically, I am analyzing the connection between the construction of the canal, and the growth of the town of Perinton, which contains the village of Fairport. Known as the “Crown Jewel of the Erie Canal,” Fairport is a village which grew economically dependent on the manmade waterway. The Establishment of the canal led to the construction of numerous schools throughout the area, which eventually became centralized in the 20th century. I plan to use mapping and timeline tools to show the evolution of the village and town.
I am currently using arcgis online mapping to plot educational points of interest in my home town. A few notable educators of Fairport were educated at schools along the canal, and returned home to teach following teacher education at Geneseo Normal School. Perinton saw a few stages of development in education structure, from one room schoolhouses to one centralized district. These changes were brought about by multiple notable events, and I am making chronological maps to display these developments next to each other.
One area where I have encountered difficulty is the implementation of a timeline. I have not yet decided if I will make a separate, interactive timeline to present next to my maps. I am learning more about arcgis and will potentially download their software to use in place of their online hosting. Within arcgis online, a user can outline areas on a map and add layers to add metadata. I have added points to my map at the current schools in the district with various pieces of information. I have looked into layering a few maps on top of each other to allow for quick transitions. This is a work in progress, and I will continue to add to my maps as I collect more data.
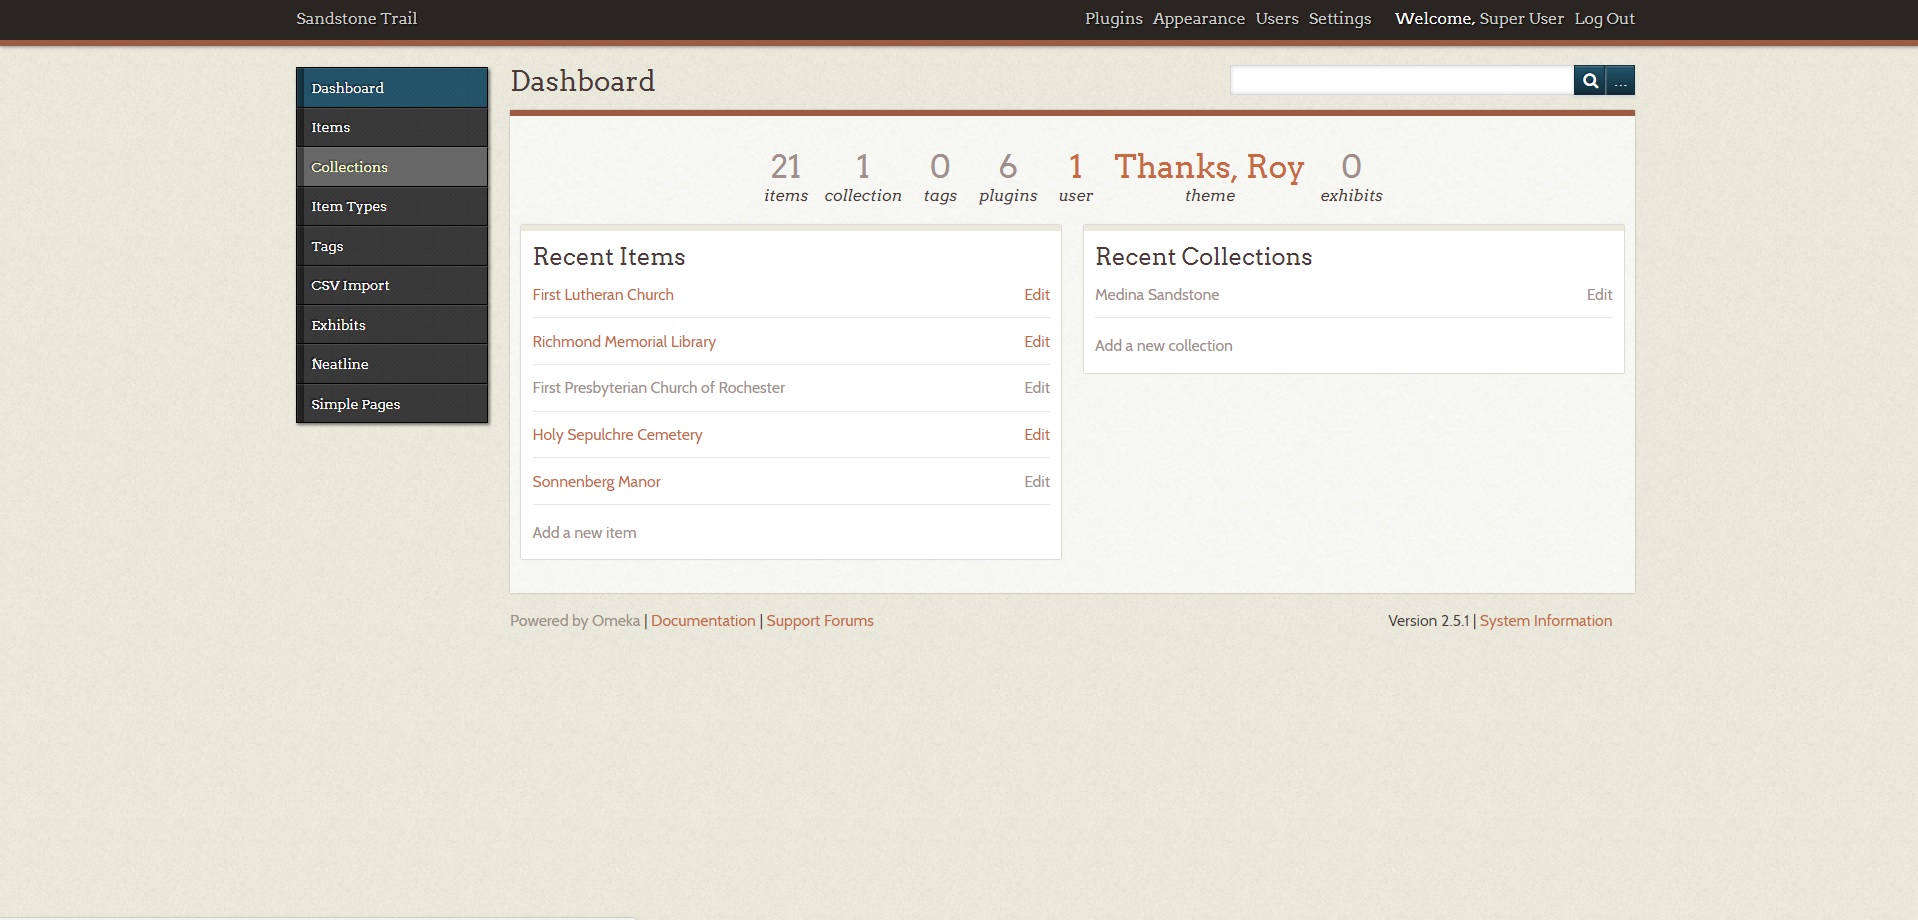
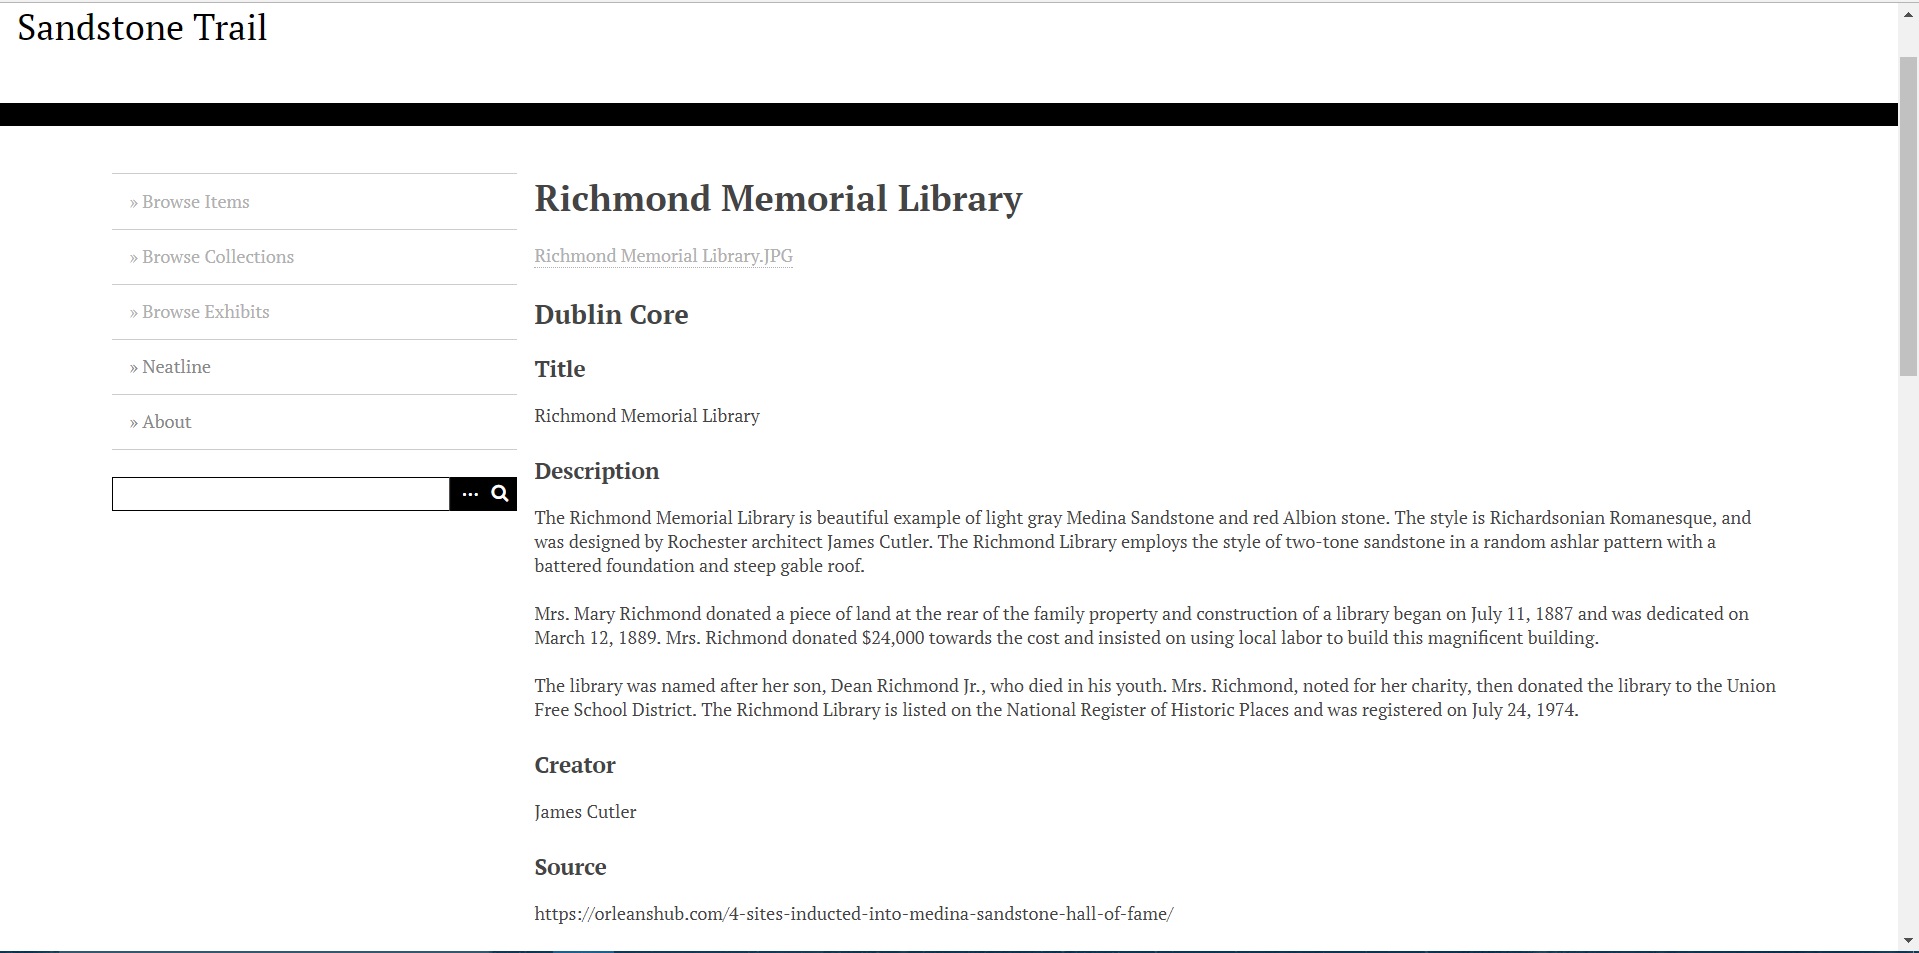
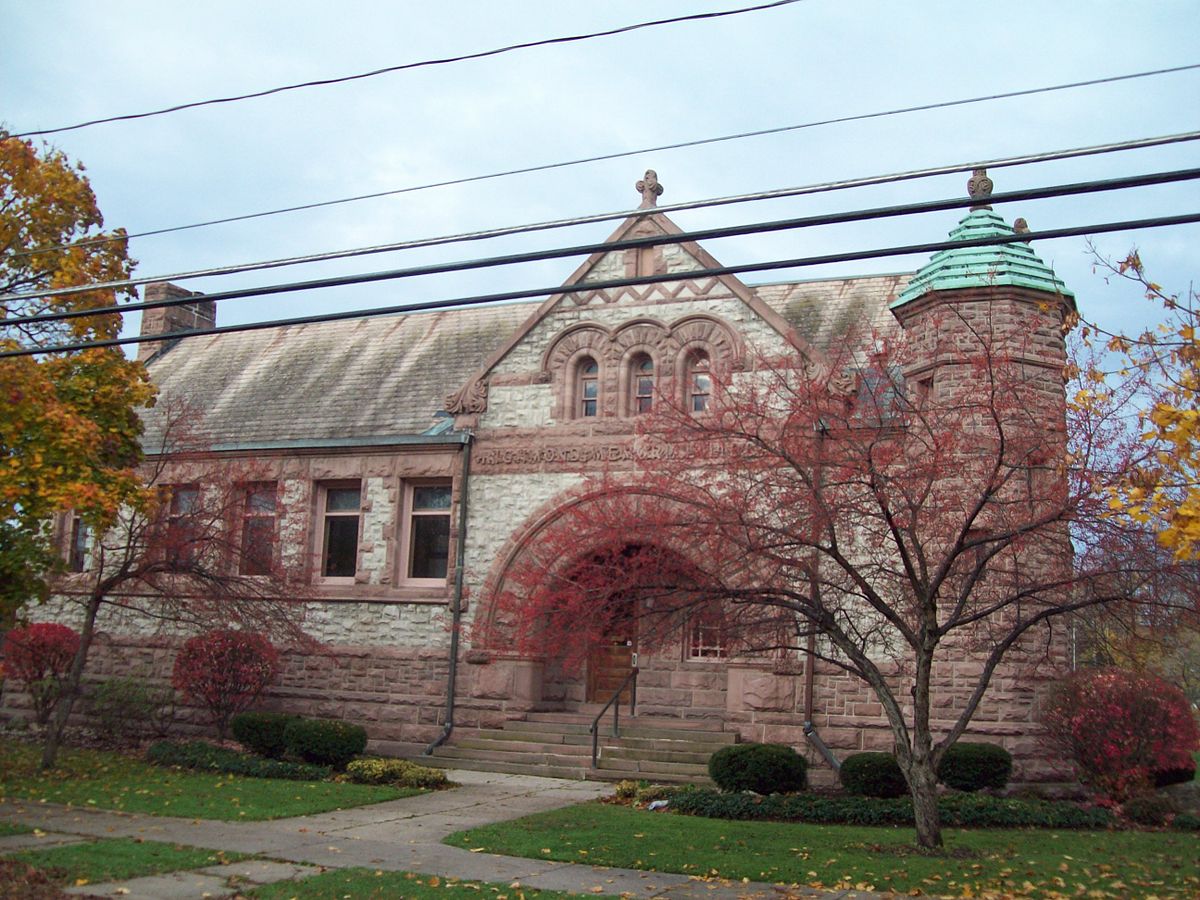
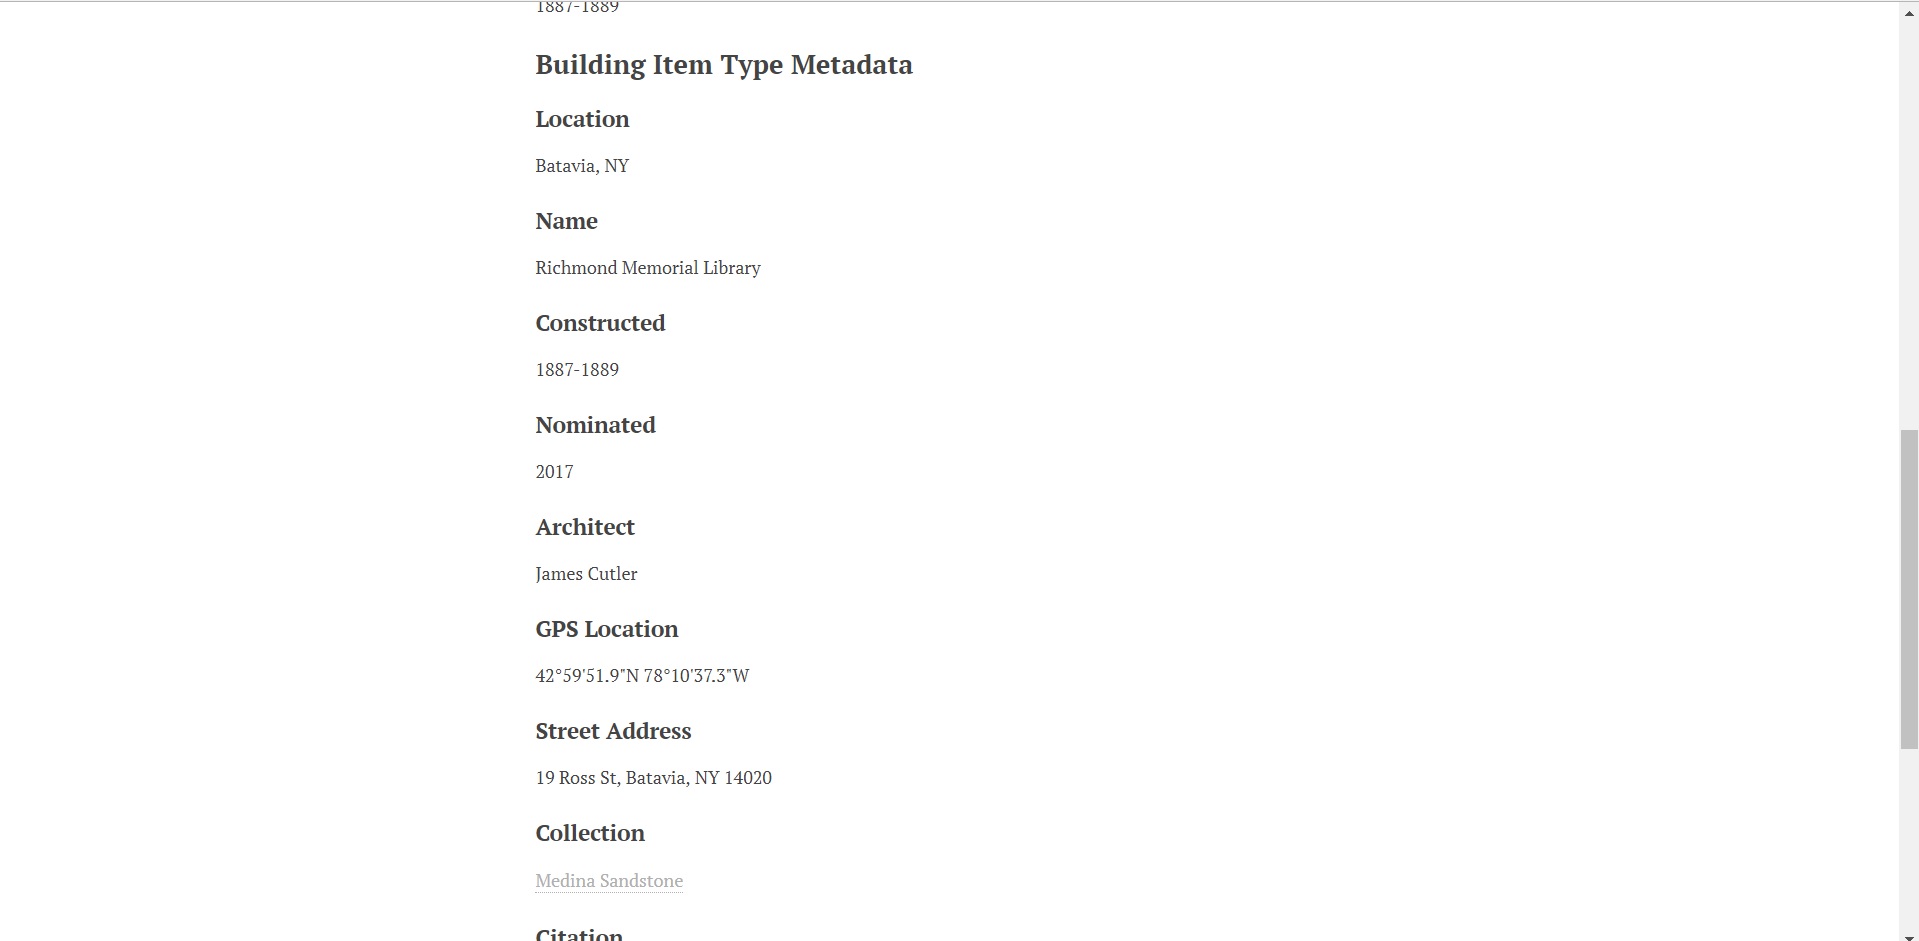
Finally, I’ve managed to get an instance of Omeka up and running, and have begun transcribing my information from my Excel spreadsheet to Omeka. The goal of my project is to still create an archive of buildings that use Medina Sandstone in New York, while also providing metadata such as their location, architect, construction year, etc. I’ve narrowed down the buildings to those that are in the “Sandstone Hall of Fame,” which was created by the Medina Sandstone Society.
Despite prior problems with Omeka, the platform has proven to be quite accessible. It was very easy to upload my information on to the platform and create tags for metadata along with it. The difficulty now lies in getting the mapping plugin, Neatline, to create a map for the information I’ve uploaded. This map is central to my project, because it is what differentiates this information from its physical form, by providing a visual of the buildings and their relation to each other, and Medina.
Once this visual portion is up and running, it will reveal some of the observations that I’ve already discovered through my work. For instance, the concentration of buildings decreases greatly as the distance from Medina increases. This raises interesting questions as to why this was. Perhaps transportation issues? Also, what was the primary transportation method for the sandstone? Another observation was that there weren’t any buildings in the list that were built past 1901. What is the reason for this? Did the sandstone industry see a decline during this time? Was there a lack of resources? Or maybe a lack of interest?
A limitation of Omeka that I’ve noticed is the inability to display an image right on the page of the item that is selected. This could just be due to a missing plugin, and the image can still be opened from the page, but it’s an aesthetic issue that does bother me. Another limitation is the lack of aesthetic options to change the style of the page. I’ve have to look more into this to see if I can find a cool theme. Another feature that does not seem to be present is a graphing function, so that I could display the frequency of the buildings that were constructed and when they were most/least popular. I’ll probably just end up creating that graph separately and uploading it individually. Lastly, the lack of functionality with Neatline is annoying, but hopefully Kirk will be able to find a solution, so that I may begin working on that aspect of my project.
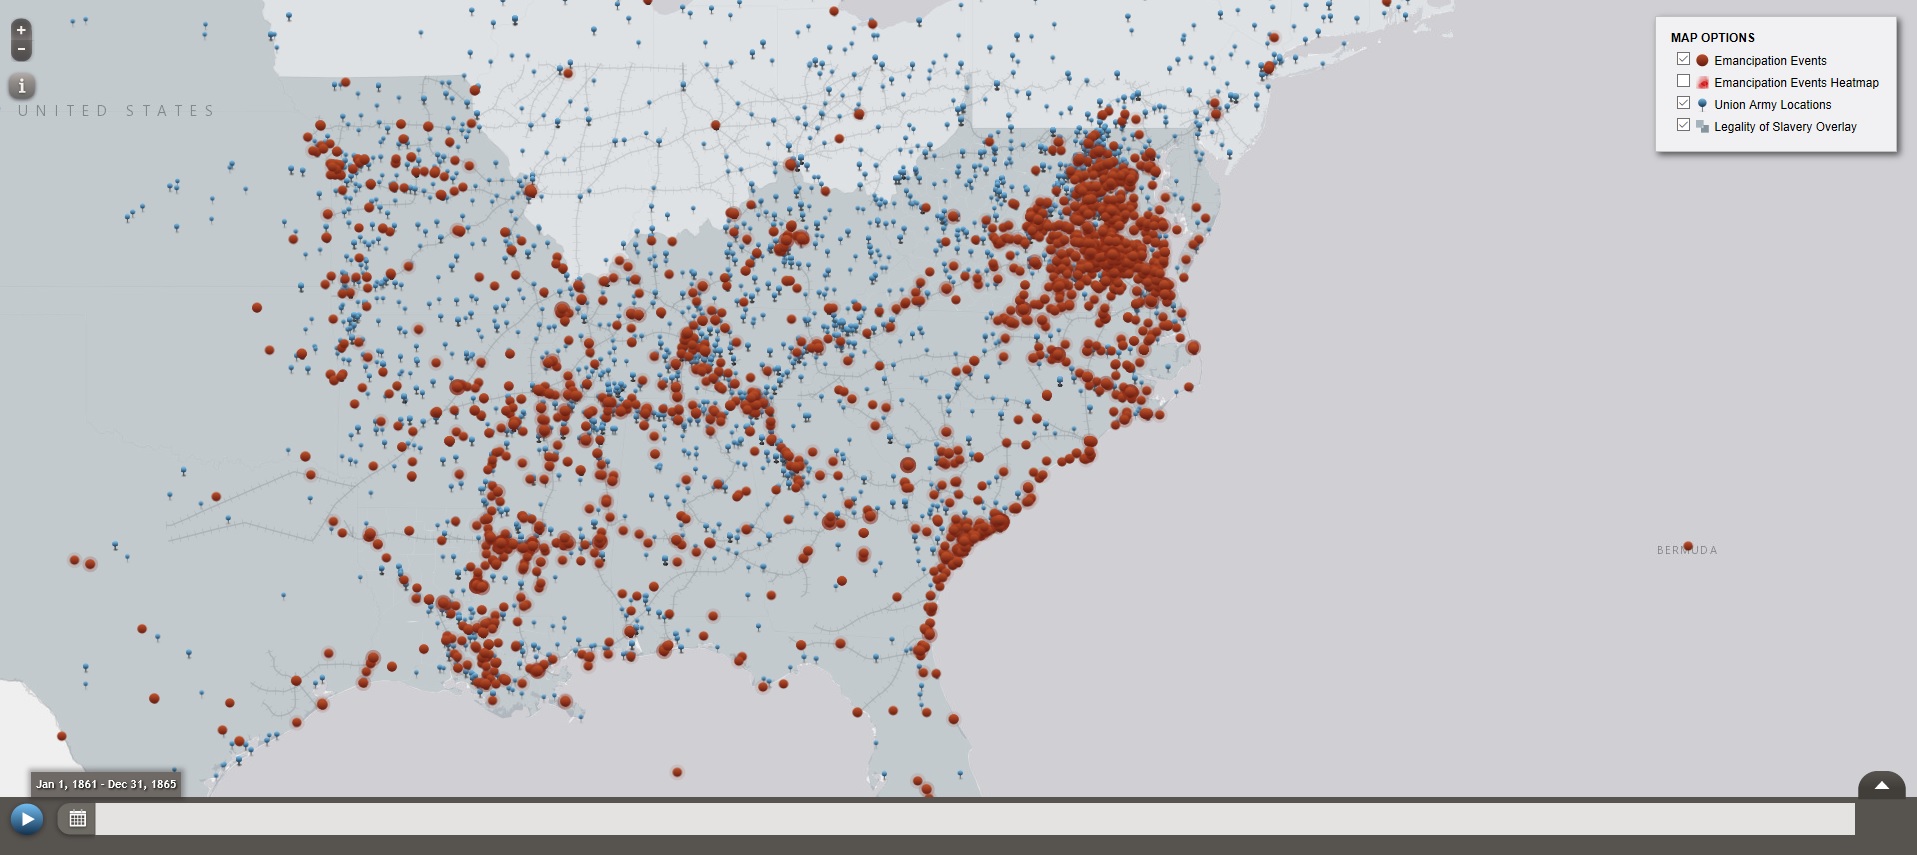
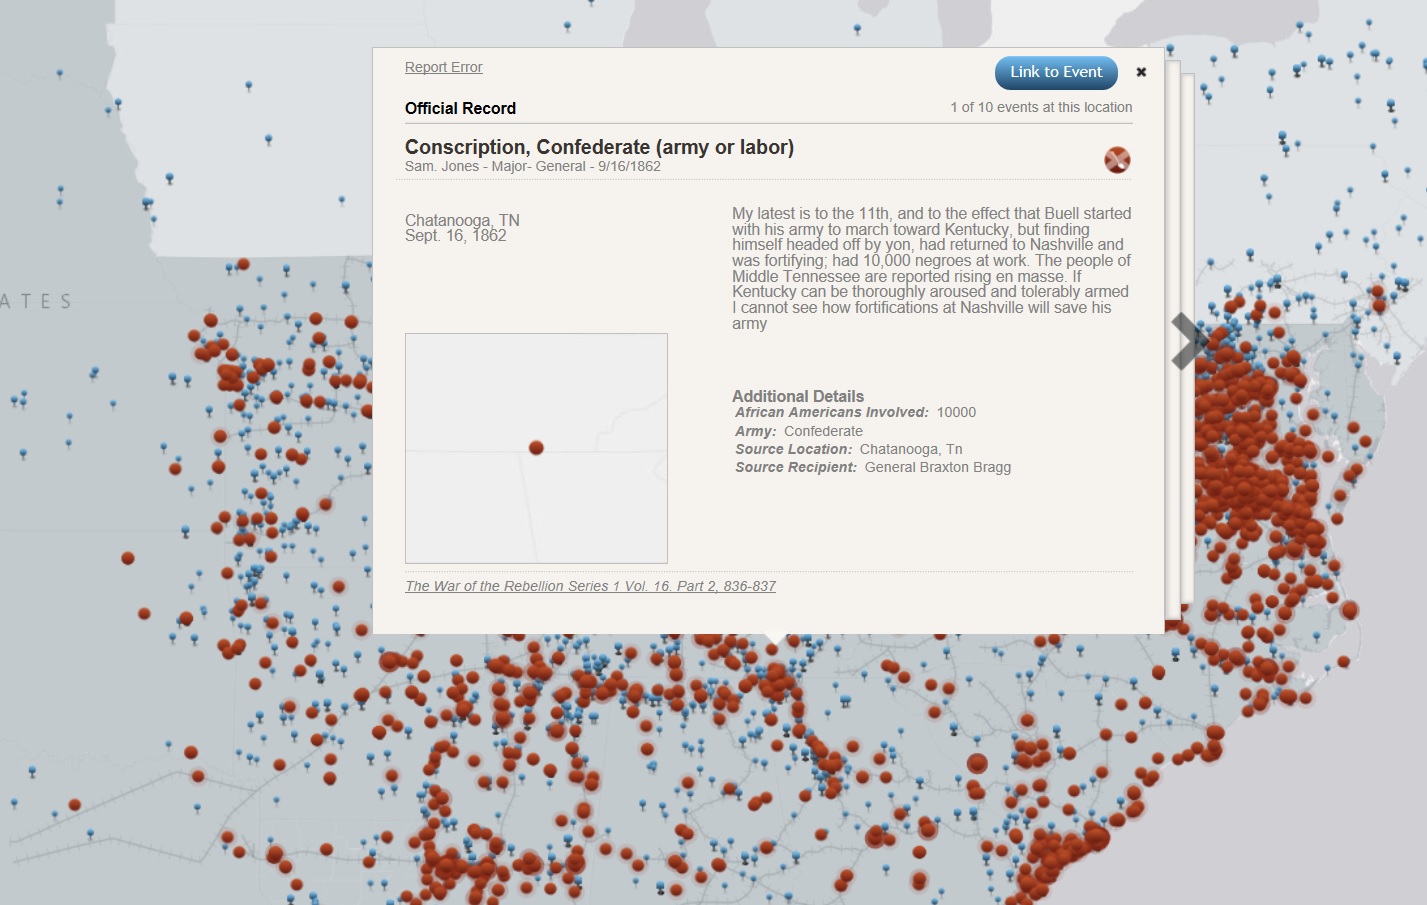
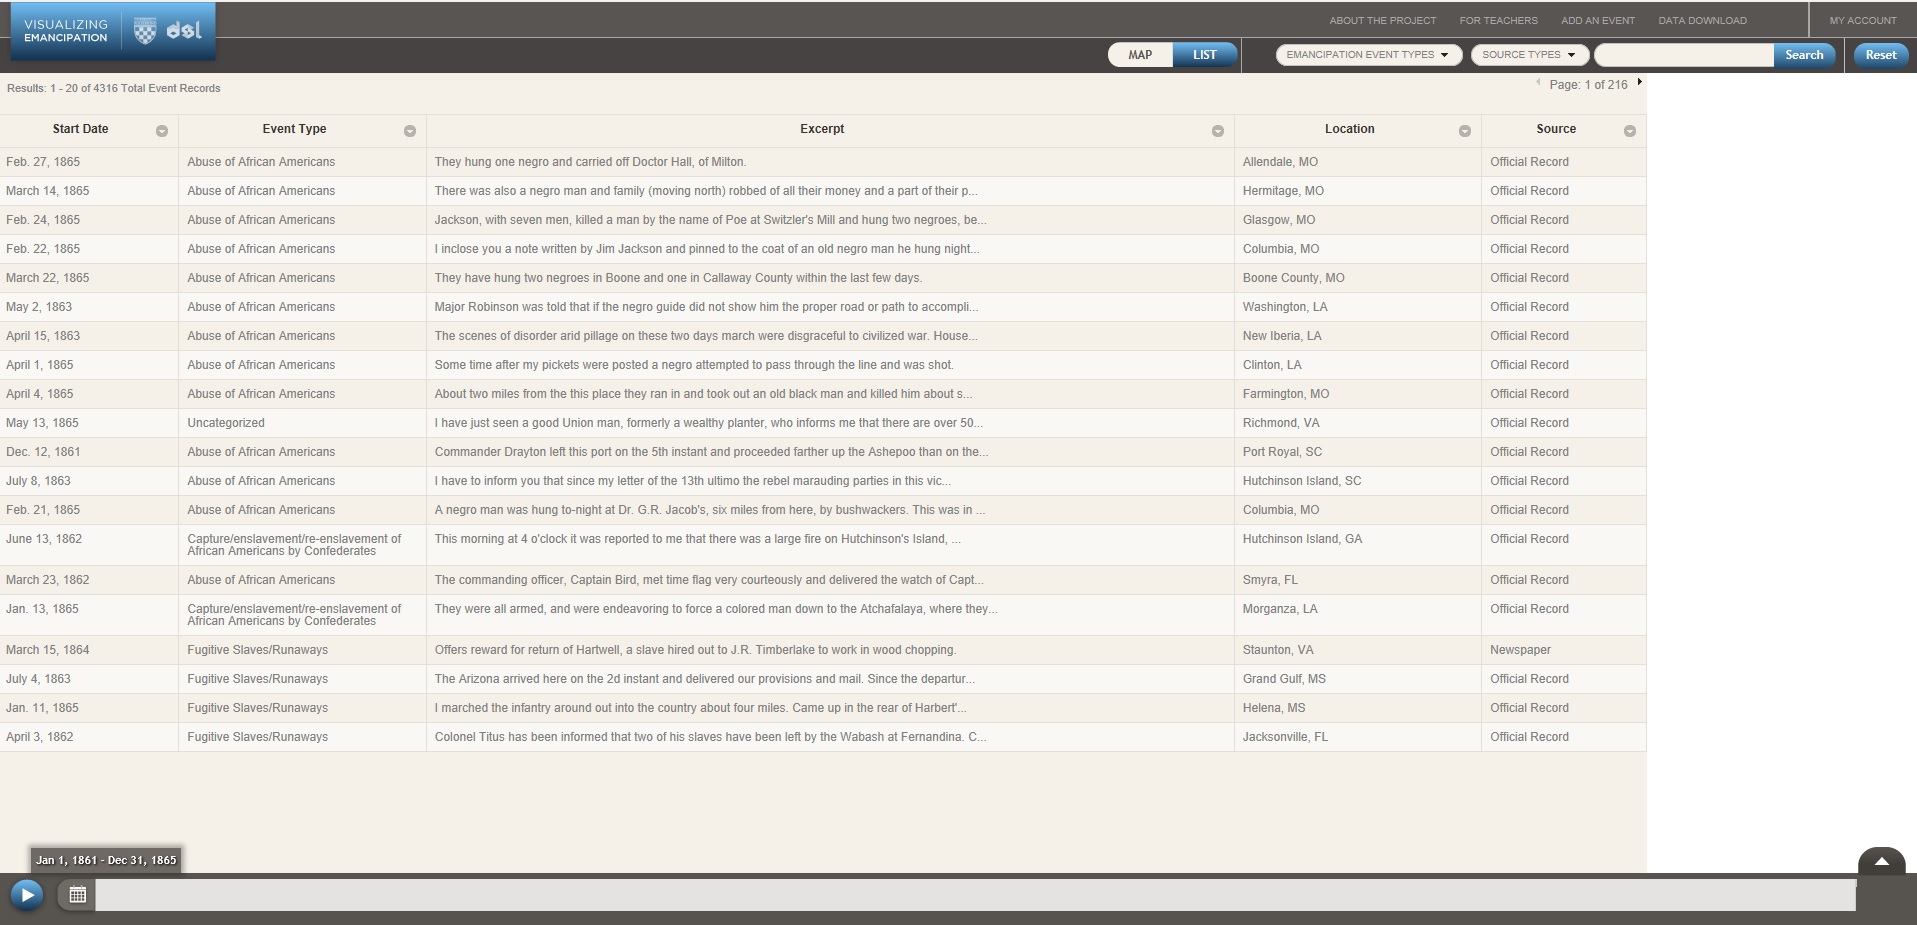
“Visualizing Emancipation” provides a detailed map of all known locations in the U.S. where a slave was emancipated in the Civil War era. This project in particular has benefited greatly from being created digitally, as it provides an interactive, simple to use interface for finding a plethora of information on emancipated slaves.
The project consists of a map with a number of red dots on it, each representing a location in which a slave was emancipated. In addition to the red dots are blue markers that represent the Union forces as they advanced through the confederacy.
These marks serve to show the relationship between the advancement of soldiers, and the increased emancipation rates.
The project’s goal is to provide a record of emancipations as they occurred throughout the U.S., while also providing a way to visual the location and frequency of these emancipations. The project advances the humanities work of organizing cultural events, analyzing historical events, and exploring relationships between events and places. The project advances a traditional humanities aim because the digital interface of the project allows the information to be organized in a way that is much easier to read and get access to. Rather than looking through numerous books to find emancipation records, you can just click on a dot on the map and it’s right there. The project utilized XML encoding, javascript, OpenLayers, and GeoServer.
While it is impossible to fully capture every single act of emancipation that occurred throughout the time period, the project does an effective job in displaying the information in an easy to understand manner, that is packed full of information on the events.
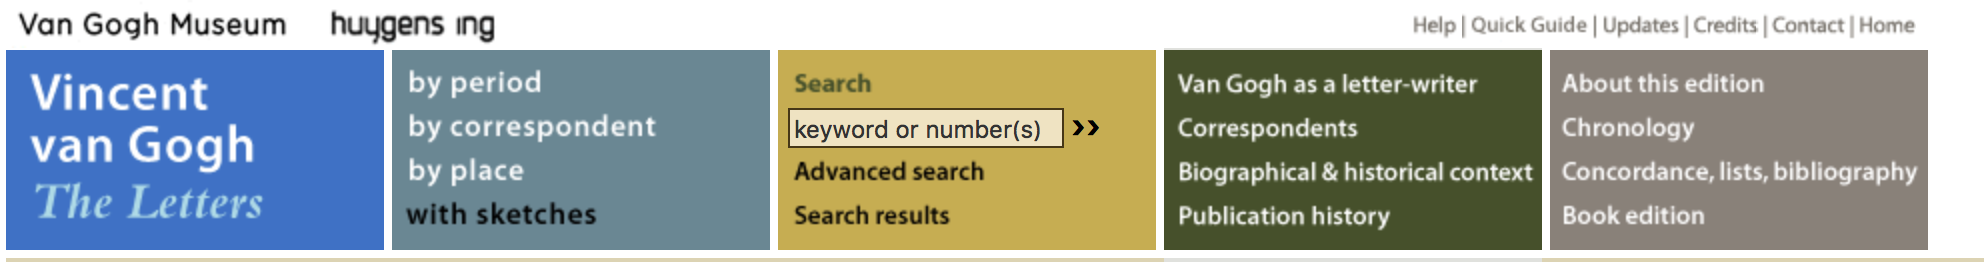
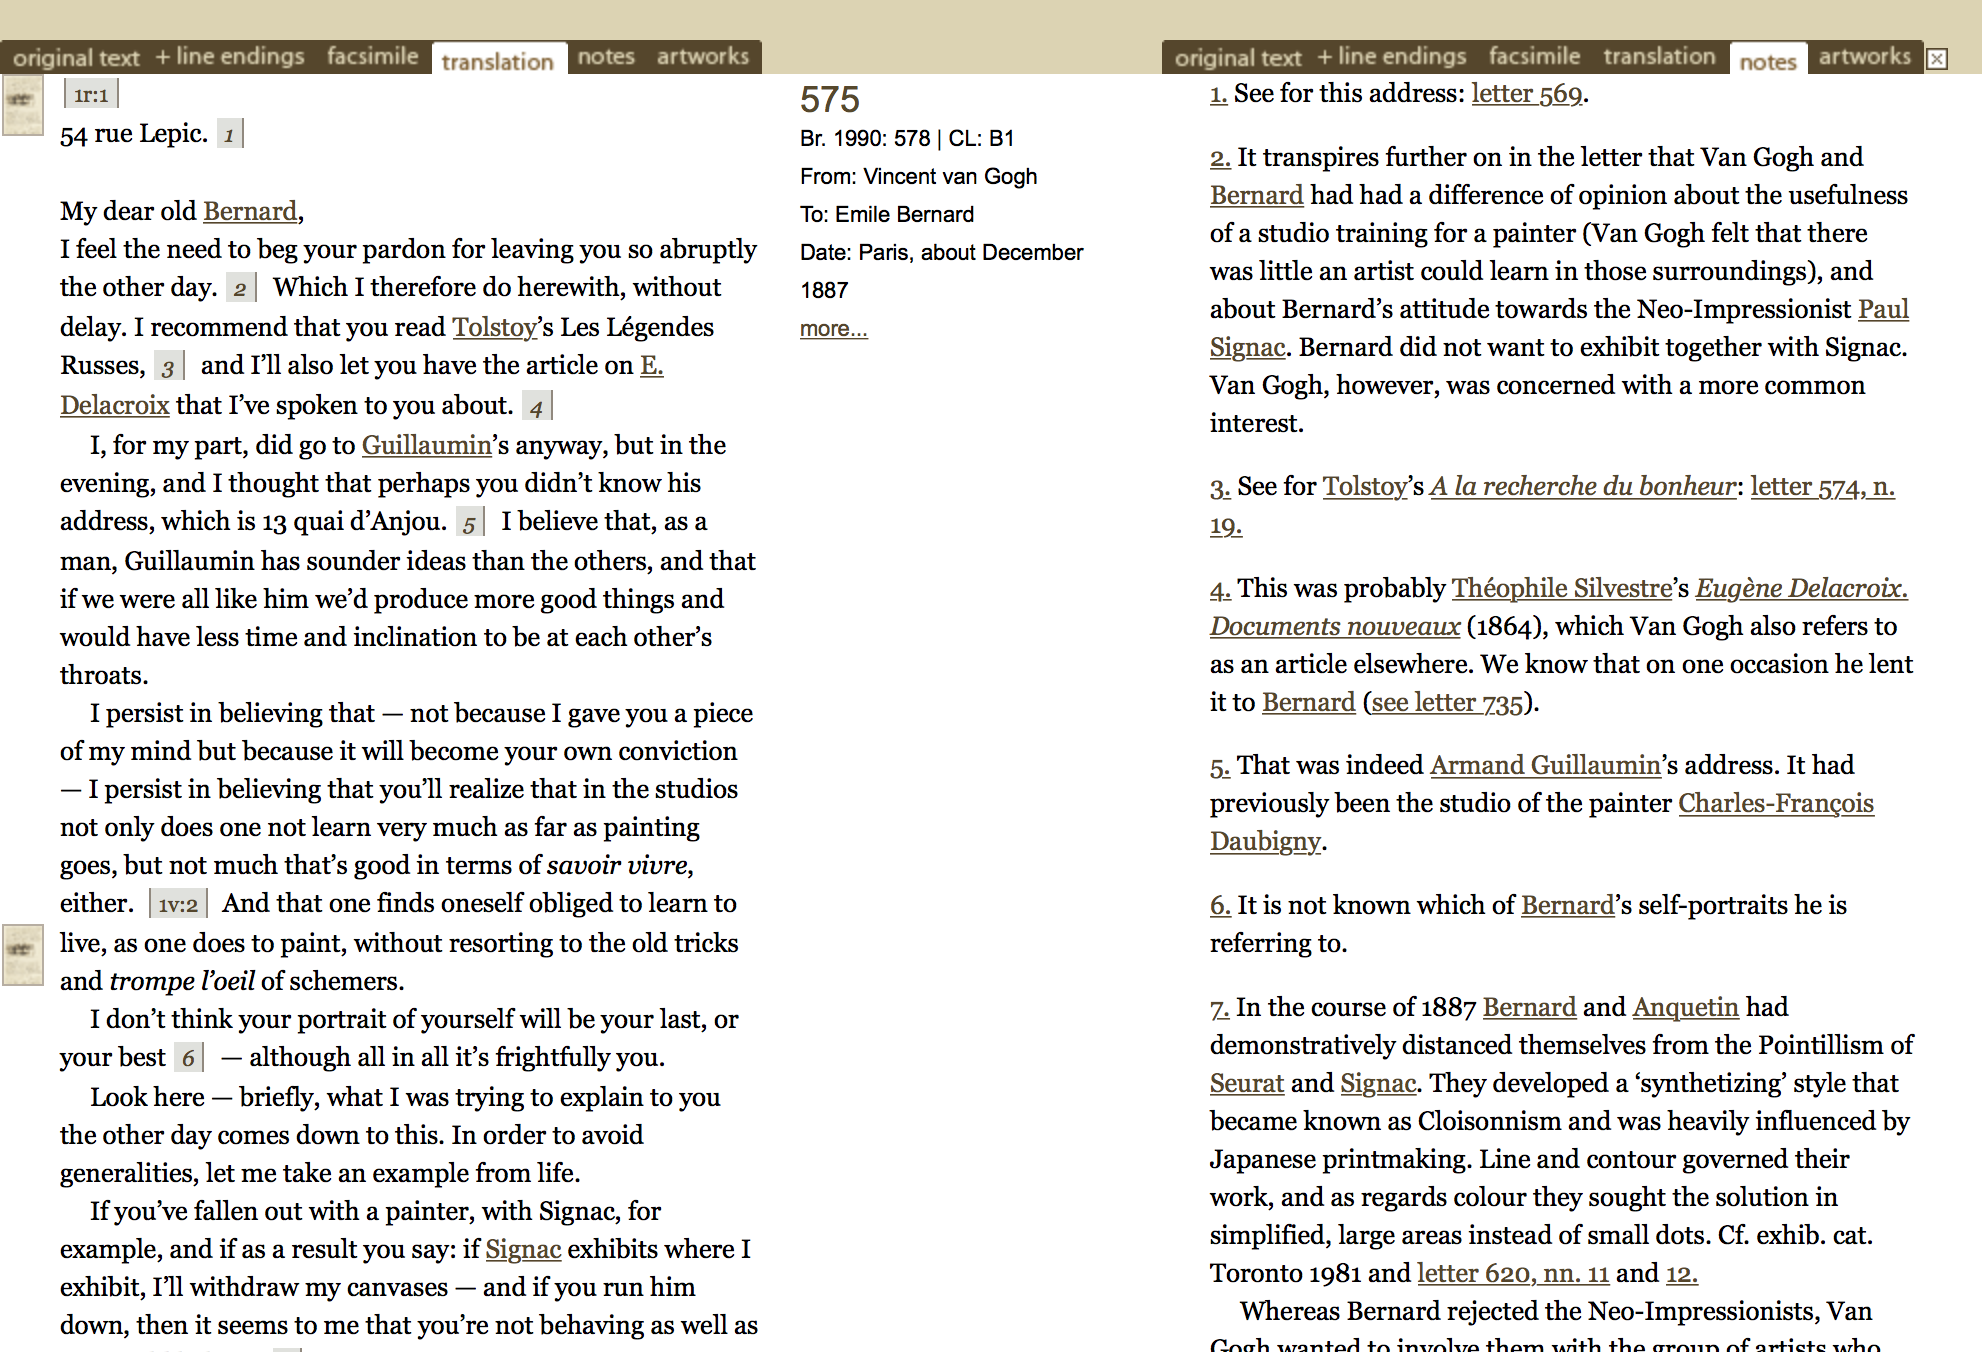
For my project, I looked at the letters of artist Vincent Van Gogh. The letters were compiled in different ways such as by time, correspondent, and location.
options to view the letters from different contexts. Also shows all of the options available to the reader.
In this way the digital project provided more information to the viewer than the original book did which only contained letters in chronological order. The program also provided automatic translation of the letters and gave the viewer the chance to compare the original to the translation. The program used XML format and more specifically TEI to achieve its purpose.
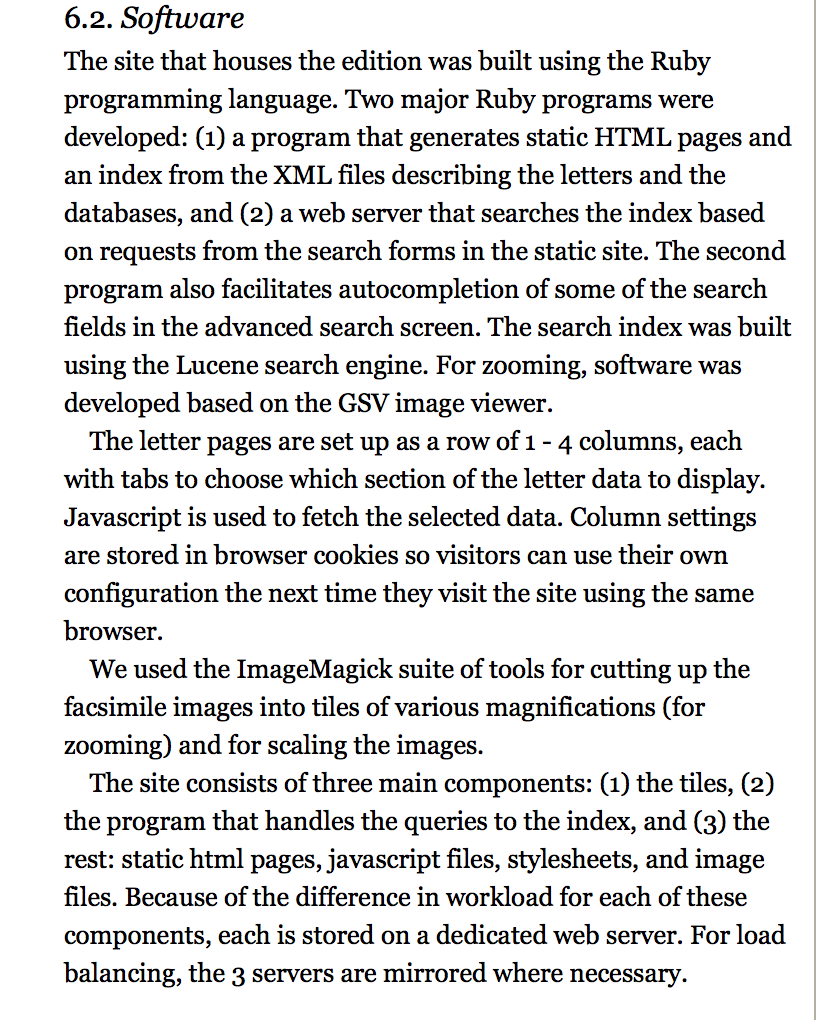
Different softwares used to create website.
The program also contained metadata that gave extra information about the letters that was not present in the book and it provides background information and historical information on Van Gogh himself along with all the other people that he corresponded with.
Analyses of letters and extra context information can be found on the right hand side of the page.
Because it is digital it is quick and easy to see the connections between the letters from different aspects like by location and time. The program also gives the viewer a way to explore different relationships between Van Gogh and his correspondents and it analyzes and interprets the letters which it doesn’t do in the book.
Throughout our project, we had to utilize various new technologies that many of us were not familiar with. A majority of our in-class planning time was spent writing scripts for our videos, and deciding what information was vital for using the site, and therefore warranted a video. We used the preexisting help page to guide us in deciding how to break up and designate the videos. We pulled from our knowledge of help pages we’ve used in the past, and came to the conclusion that one of the problems we’ve encountered with video help pages is that it’s difficult to pinpoint the instructions that directly address the individual problem. We considered a table of contents for our video but even that seemed too inefficient. We endeavored to create a more productive tutorial that could offer users instant and specific guidance. As a result, we decided to make a multitude of shorter and more direct videos, to establish that the help page is as user-friendly as possible. It was up to us to condense as much aid and instruction into a series of short tutorials. It was not a simple feat since the previous year’s group could compile their detailed instruction into a drawn-out text. Additionally, we searched for a way to put our own spin on it.
Once we decided how to break up our videos, we scheduled a time to meet with the Digital Media Lab assistants. Our preliminary meeting was simple: we asked what kinds of tools we could access if we were to use the Digital Media Lab and how easy this technology would be to operate. We were introduced to Camtasia, a program that allows you to capture and record screen activity as you navigate. A microphone records your voice to provide simultaneous narration. In essence, Camtasia allows for the user to be “present” by being able to visually and audibly learn what the instructor is doing. We decided to use Camtasia to make our videos; we planned to create an account and record us chronicling the step-by-step.
We booked a time to meet in the DML and recorded a video on our first visit. Aside from a few last minute script rewrites to ensure fluidity, everything was going according to plan. A funny note about a problem we had was when realized that the DML itself shares a wall with a bathroom in Milne, so there were some times where we had to wait to record to make sure no sounds of running water or hand dryers made their way into our video!
We faced a few administrative troubles, including a time when the Milne staff could not find the key to the DML, but after some discussion and searching, our plans went off relatively without a hitch. There was also the instance when Dr. Schacht denied our example account entrance into the group forum after mistaking it as spam. Without access, one of our videos could not be produced. This mild setback halted progress for that video by a day or two, but we hold no grudges. Example123@gmail.com sounds like a pretty faceless email address. We would have done the same.
We had to do a few retakes, but the reasons were nothing more than verbal stumbles; minor edits were accomplished through iMovie. iMovie was another technology we used, as stated before, mainly for smaller edits and some decorative polishing, such as the title slides.
In retrospect, it is interesting to consider what Thoreau might have thought of our videos, and the Digital Thoreau website in general. Would he think that those who need the videos should not have access to the information, much like he thought that the Classics should not be read by those who did not understand the original language? Or would he be pleased to know that his work was being spread to a larger audience? Thoreau’s revulsion towards innovation and technology is apparent throughout Walden, but his encouragement for advancement through learning is evident as well. In his conclusion Thoreau writes, “Things do not change; we change,” and we can justify our digital work with this maxim. As a future generation we have access to the technology and modernization of the 21st century, which we have employed in order to spread Thoreau’s teachings. Thus, a man who promoted learning and acknowledged change would deem our efforts worthy.
Group 3: Allison Fox, Aran Fox, Maya Merberg, Kaitlin Pfundstein and Grace Rowan
 project, we had to utilize various new technologies that many of us were not familiar with. A majority of our in-class planning time was spent writing scripts for our videos, and deciding what information was vital for using the site, and therefore warranted a video. We used the preexisting help page to guide us in deciding how to break up and designate the videos. We pulled from our knowledge of help pages we’ve used in the past, and came to the conclusion that one of the problems we’ve encountered with video help pages is that it’s difficult to pinpoint the instructions that directly address the individual problem. We considered a table of contents for our video but even that seemed too inefficient. We endeavored to create a more productive tutorial that could offer users instant and specific guidance. As a result, we decided to make a multitude of shorter and more direct videos, to establish that the help page is as user-friendly as possible. It was up to us to condense as much aid and instruction into a series of short tutorials. It was not a simple feat since the previous year’s group could compile their detailed instruction into a drawn-out