After the Civil War, there was a surge of African-Americans into politics. This lasted until the late 19th century, when racist practices and legislature forced many African-Americans out of the political sphere.
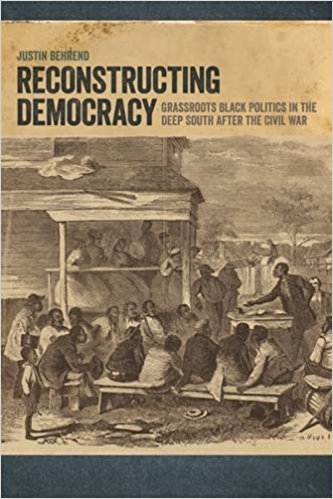
 Professor Behrend, a history professor at SUNY Geneseo, focuses his research on black politicians during this time period, specifically in the Natchez region. This region—named for the city of Natchez—comprises six main counties straddling Mississippi and Louisiana. Behrend’s book, Reconstructing Democracy: Grassroots Black Politics in the Deep South After the Civil War, argues that the amount and range of offices held by black politicians during this relatively short period of time (roughly 30 years, from the late 1860s to the 1890s) represents a grassroots democracy movement by black communities in opposition to the white power structures surrounding them.
Data collected by Behrend about the African-American politicians during the post-Civil War Natchez region covers both information about the offices they held as well as personal information such as other occupations, literacy status, county affiliation, and many other categories. Professor Behrend stored this information in a spreadsheet which he published to the web a few years ago. Through this digital humanities project, Professor Behrend and I wanted to create a new and more interactive place to store this data. Based on that goal, I knew I wanted to create a map of the politicians.
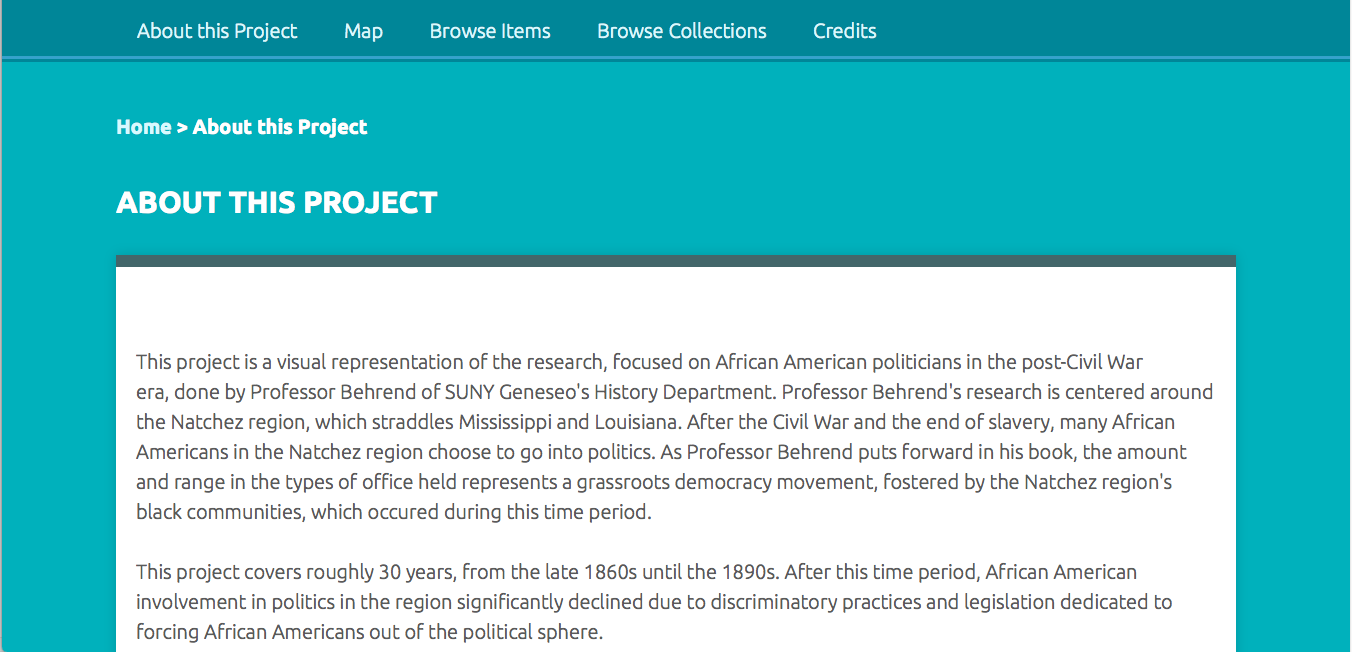
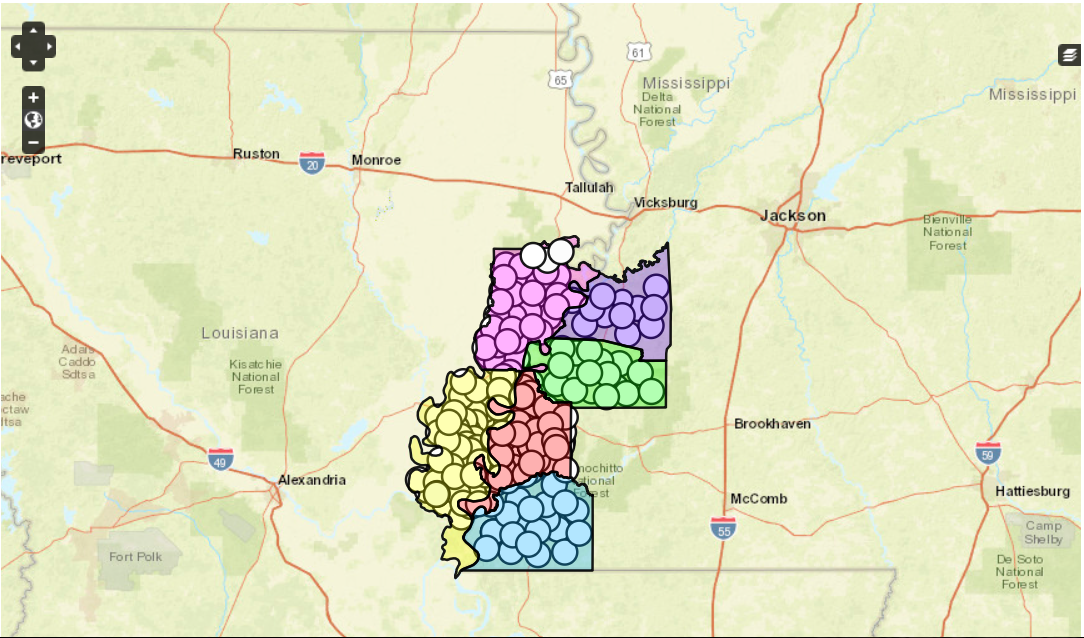
My project website, hosted by Omeka, opens with a short “About” page to give any visitors context about the origins and purpose of the project. Visitors can then click on the “map” tab to take them to the map I created using Neatline. Visitors can also click on either the “Browse Items” tab or the “Browse Collections” tab to peruse the data by individual person. I also have a tab labelled “Credits” where I give credit to and thank those who have helped me along the way with this project, namely Professors Behrend and Schacht, Dr. Kirk Anne, and Wayne Graham on GitHub (whose Neatline base map I used as the background for this project).

I decided to use Omeka and specifically the plugin Neatline to create the map. I decided on this because I knew that Neatline could create a map with multiple elements, including layers for the multiple counties and a pop-up box with information about the person when you click on their point on the map. Using a map to visualize data (especially connecting people and places) is an idea seen very often in traditional humanities. Seeing data, rather than simply reading about it, is a well-known method of increasing one’s understanding of the data and the overall argument. This project in particular uses a map to emphasize Professor Behrend’s argument about black communities creating a grassroots democracy through becoming elected officials in their region. When one first clicks on the map, it is obvious by the amount of points on the map that African-American political activity was significantly high during this relatively short time period. Beyond the traditional humanities, hosting a map on an Omeka site through Neatline—instead of creating a physical map—adds another useful element because you can include significantly more information. A digital map created with these programs allows an interested party to not only visualize the concepts but read more about each individual person represented in the data. A physical map does not have the ability to load up a sidebar of information when one clicks on a data point. The power to do this, particularly in a case like this project where you have many data points (roughly 400), makes the digital map even more useful than a physical one.

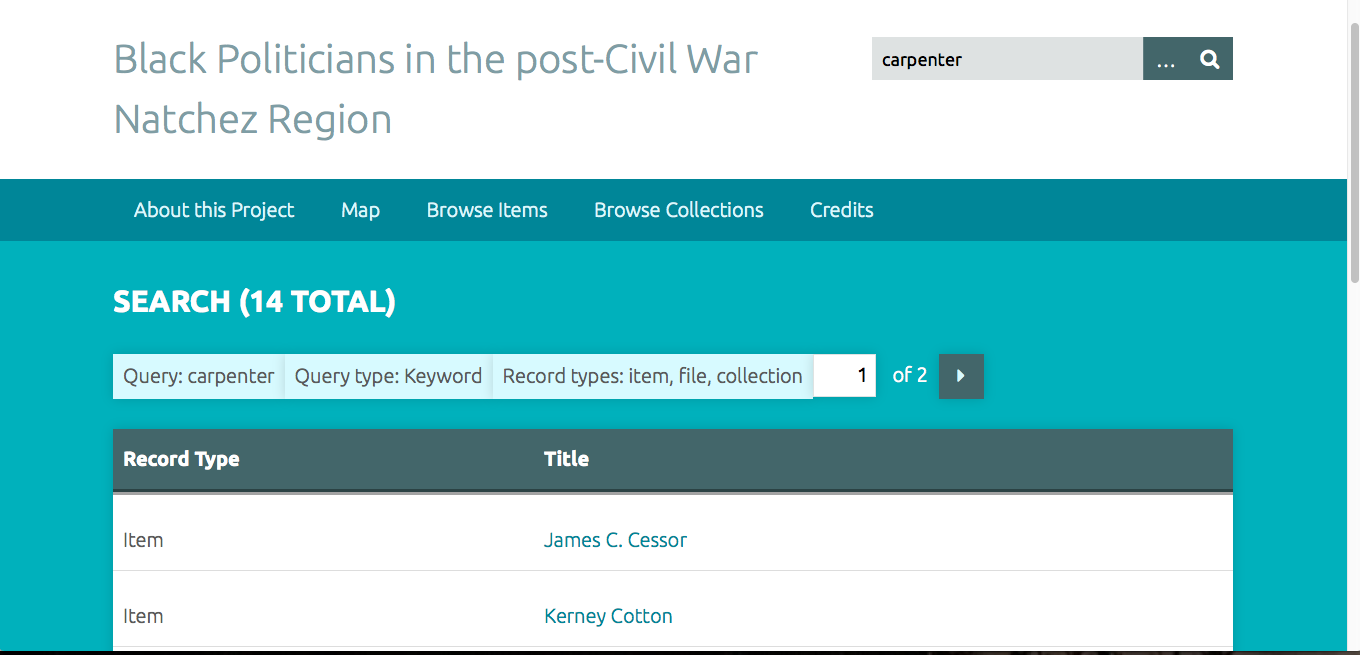
Another advantage of using Omeka was how well the archiving portion of the software suited the spreadsheet origins of this project. While archives are created and used all the time by traditional humanities projects, having an online archive run by Omeka offers additional features that a physical archive does not. The first advantage is the enlarged audience a digital archive can reach. Being able to access the archive using the Internet (not having to travel to a physical place) opens the door for more people to find and use the data. A digital map may also attract a larger audience since it is a quicker and easier way of demonstrating a main concept than reading the book. The other significant advantage of a digital archive is the interactive portion that Omeka offers. When I started this project, I did not anticipate that the Omeka archive would be searchable. However, now at the conclusion of this project, I realize that being able to search all items for specific terms is incredibly handy. For instance, if someone is searching the database for a specific person but only knows their occupation (say carpenter) and their birthdate (say 1837) then they could search the database for “carpenter” and cross-reference the results for people born in 1837 to find their person. The searchable aspect of this digital archive is also useful for anyone utilizing the data to find patterns for their own projects.

While creating this project I encountered a few challenges working with Omeka and particularly Neatline. The first problem I encountered was getting Neatline to work on my computer at all. Professor Schacht helped me solve this problem as he posted on a help forum and figured out that a typo in the Neatline file folder was preventing functional use of the program. A problem I ran into while creating the map was uploading files which had outlines of the county maps. I had found a website which specialized in historic county maps and had them available for download as either ArcGIS or KML files. Originally I thought I would be able to turn the KML files (KML being a type of XML) into SVG files, which are importable to Neatline. However, I could not find a KML to SVG converter that had the ability to convert the files. To overcome this problem I utilized Neatline’s “Draw a Polygon” tool and traced the county borders myself.
Overall, I learned how to work with online exhibits, data collections, and digital maps. At the beginning, while I was figuring out which program to use, I played around with Google MyMaps and TimelineJS so I learned the basics of those programs as well. Learning how to use Omeka is particularly relevant to me since I am currently applying to graduate school for archive management. Omeka is often used by archivists to create online collections so learning how to use the program and gaining hands-on experience with it will most likely be useful for me in the future. Engaging with questions of how to create a digital archive and map—both in the technical sense of how to use the programs and in the more abstract sense of what information to include, how to space the data points, and what each design decision means for the interpretation of the data—has given me a solid introductory grasp on what the digital humanities are and how they can be applied.
While my project did not necessarily reach any new conclusions about this data, I think it did reinforce Professor Behrend’s thesis in a new way. Being able to see how many African American politicians existed in this region (roughly 400) over a fairly short period of 30 years underscores the political and social agency which black communities created for themselves. This period of black political activity is often not covered in American history classes so it is important to acknowledge its existence. Using Omeka and Neatline offered a way to both create an interactive digital archive—an evolution of Behrend’s original spreadsheet—as well as convey this thesis through a visual component.
